7 reasons to stay invested during market uncertainty
Maintain a long-term perspective during periods of heightened volatility.

When market conditions are highly uncertain, even the most seasoned investors can become concerned. However, history shows that time is on the side of the long-term investor.
That’s why it’s important to take the long view and trust the financial strategy built around your risk tolerance, time horizon and goals. A well-diversified portfolio, with a balanced mix of investments and asset classes, can also help lessen the risk of loss against prolonged market volatility.
An Ameriprise advisor is here to support you through all market cycles so that you can stay on track to reaching your financial goals.
Consider these seven reasons to remain invested through all market conditions:
1. The U.S. stock market shows resiliency over time
From the Great Depression to worldwide wars to the Global Financial Crisis, the U.S. stock market has faced many challenges — but still has risen over time. While it’s not easy to see your portfolio’s value drop, history suggests that “this too shall pass.”
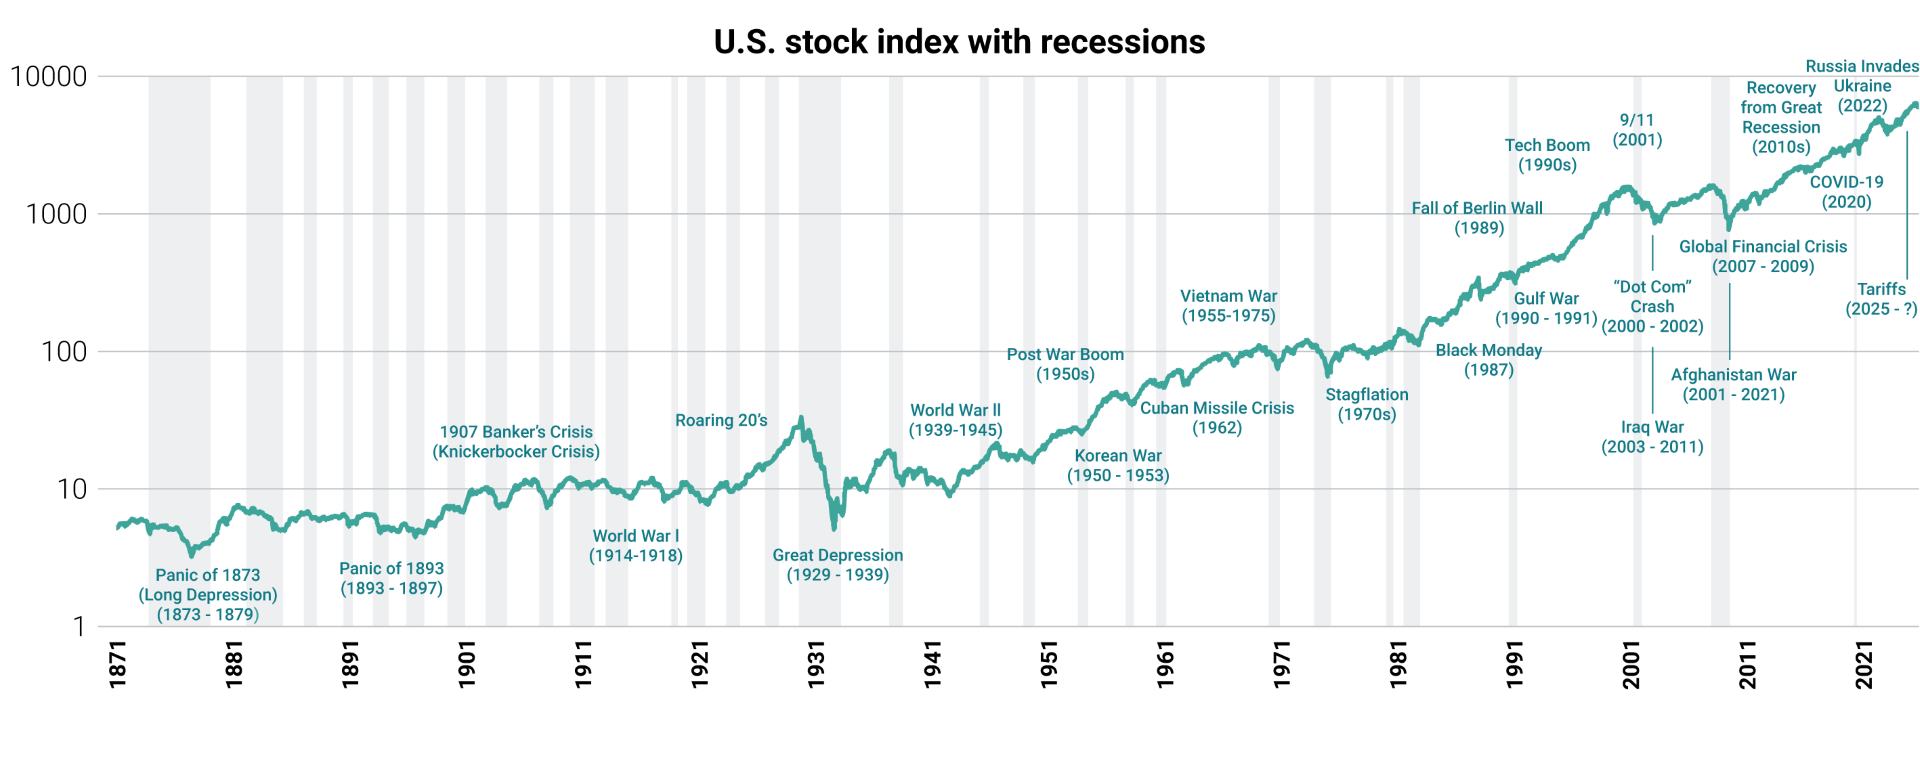
Source: NBER, Bloomberg, S&P Dow Jones Indices, American Enterprise Investment Services, Inc.
Data shown is based on the following: 1871 - 1917, Cowles Commission Index as converted by the Standard & Poors Corporation and available through the National Bureau of Economic Research (NBER). 1918 - 1956, monthly average of the weekly Standard and Poors weekly composite price index based on Wednesday's close and as available by the NBER. 1957 through 12/31/2025, monthly closing price of the S&P 500 Price Index. Recessions are as defined by the NBER and highlighted by the vertical gray bars.
Data prior to 1957 rescaled. Chart presented in log scale. These figures are shown for illustrative purposes only and are not guaranteed. An index is a statistical composite that is not managed. It is not possible to invest directly in an index. Past performance is not a guarantee of future results.
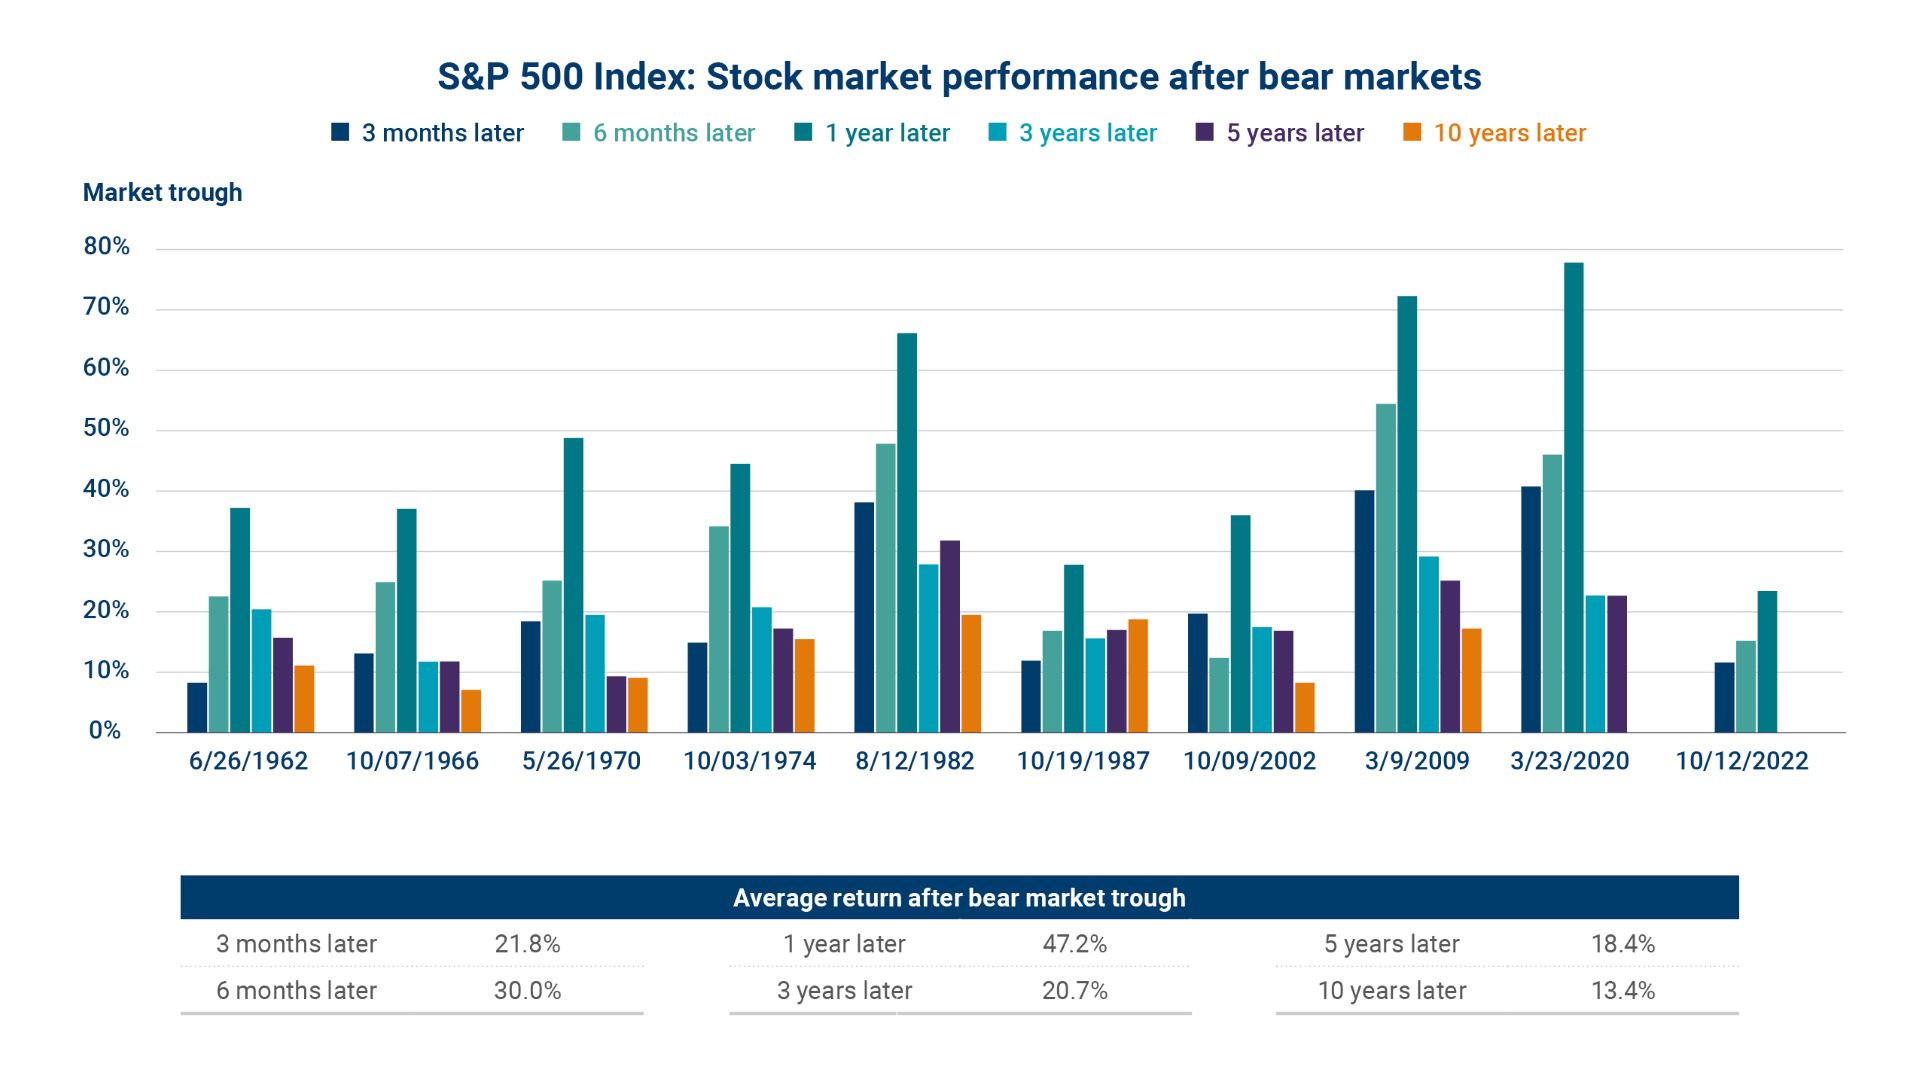
Source: Bloomberg, S&P Dow Jones Indices, American Enterprise Investment Services, Inc. Data is based on the S&P 500 Price Return Index and is current through 12/31/2025. These figures are shown for illustrative purposes only and are not guaranteed. An index is a statistical composite that is not managed. It is not possible to invest directly in an index. Past performance is not a guarantee of future results.
3. Back-to-back yearly market declines are rare
Market declines are often temporary. Negative returns over consecutive calendar years are relatively rare in the stock market. Since 1929, the S&P 500 has experienced four times as many years with double-digit gains than those with double-digit losses.
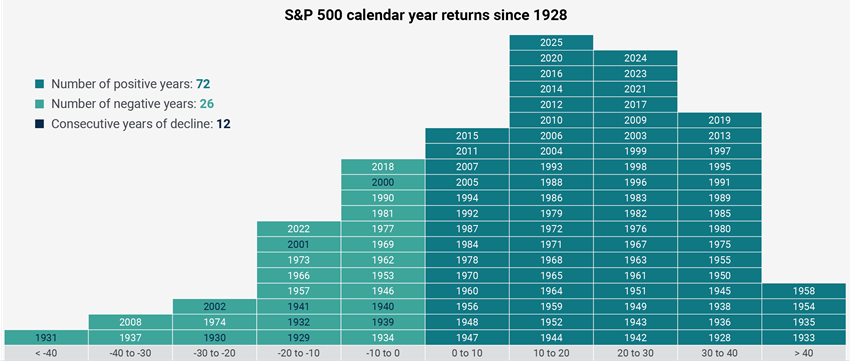
Source: Bloomberg, S&P Dow Jones Indices. Data is based on the S&P 500 Total Return Index and current through 12/31/2025. This example is shown for illustrative purposes only and is not guaranteed. An index is a statistical composite that is not managed. It is not possible to invest directly in an index. Past performance is not a guarantee of future results.
Source: Bloomberg, S&P Dow Jones Indices. Data is based on the S&P 500 Total Return Index and current through 12/31/2025. These figures are shown for illustrative purposes only and are not guaranteed. They do not reflect taxes or investment/product fees or expenses, which would reduce the figures shown here. An index is a statistical composite that is not managed. It is not possible to invest directly in an index. Past performance is not a guarantee of future results.
5. Market volatility can offer an investment opportunity
It’s natural to consider investing less money into stocks when the market drops. However, history shows that over time, investing into uncertainty can be advantageous.
The chart below shows how investing during high periods of volatility can lead to long-term gains that may be higher than the S&P 500’s median returns. The VIX (Volatility Index) is a measure of market volatility. The higher the VIX, the greater the volatility.
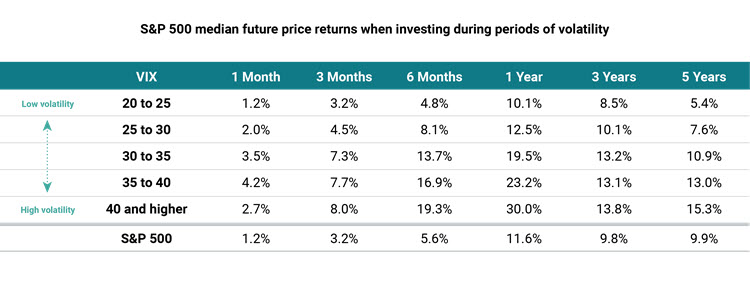
Source: Bloomberg, Cboe Global Markets, S&P Dow Jones Indices, American Enterprise Investment Services, Inc. Returns are the forward returns of the S&P 500 Price Return index for each specific period and based on the VIX levels described. Returns are annualized for time periods longer than one year. Data from 1/2/1990 through 12/31/2025. These figures are shown for illustrative purposes only and are not guaranteed. They do not reflect taxes or investment/product fees or expenses, which would reduce the figures shown here. An index is a statistical composite that is not managed. It is not possible to invest directly in an index. Past performance is not a guarantee of future results.
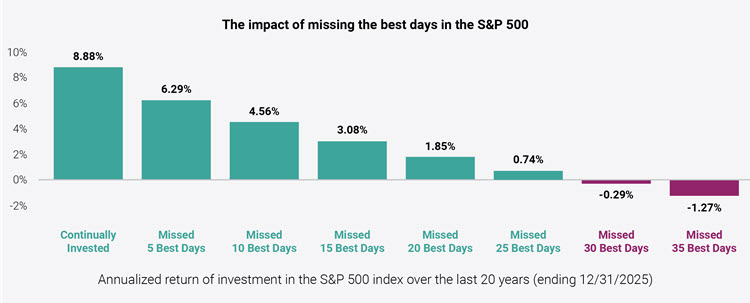
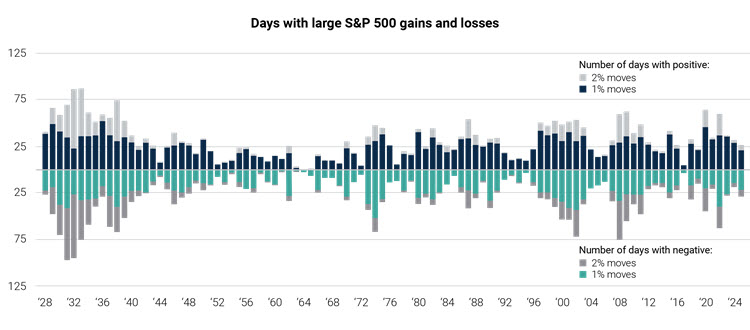
Source: Bloomberg, S&P Dow Jones Indices, American Enterprise Investment Services, Inc. Returns assume the investor was fully and continually invested in the S&P 500 Price Return Index except for the days specified. Calculations assume no fees or transaction costs. These figures are shown for illustrative purposes only and are not guaranteed. An index is a statistical composite that is not managed. It is not possible to invest directly in an index. Past performance is not a guarantee of future results.
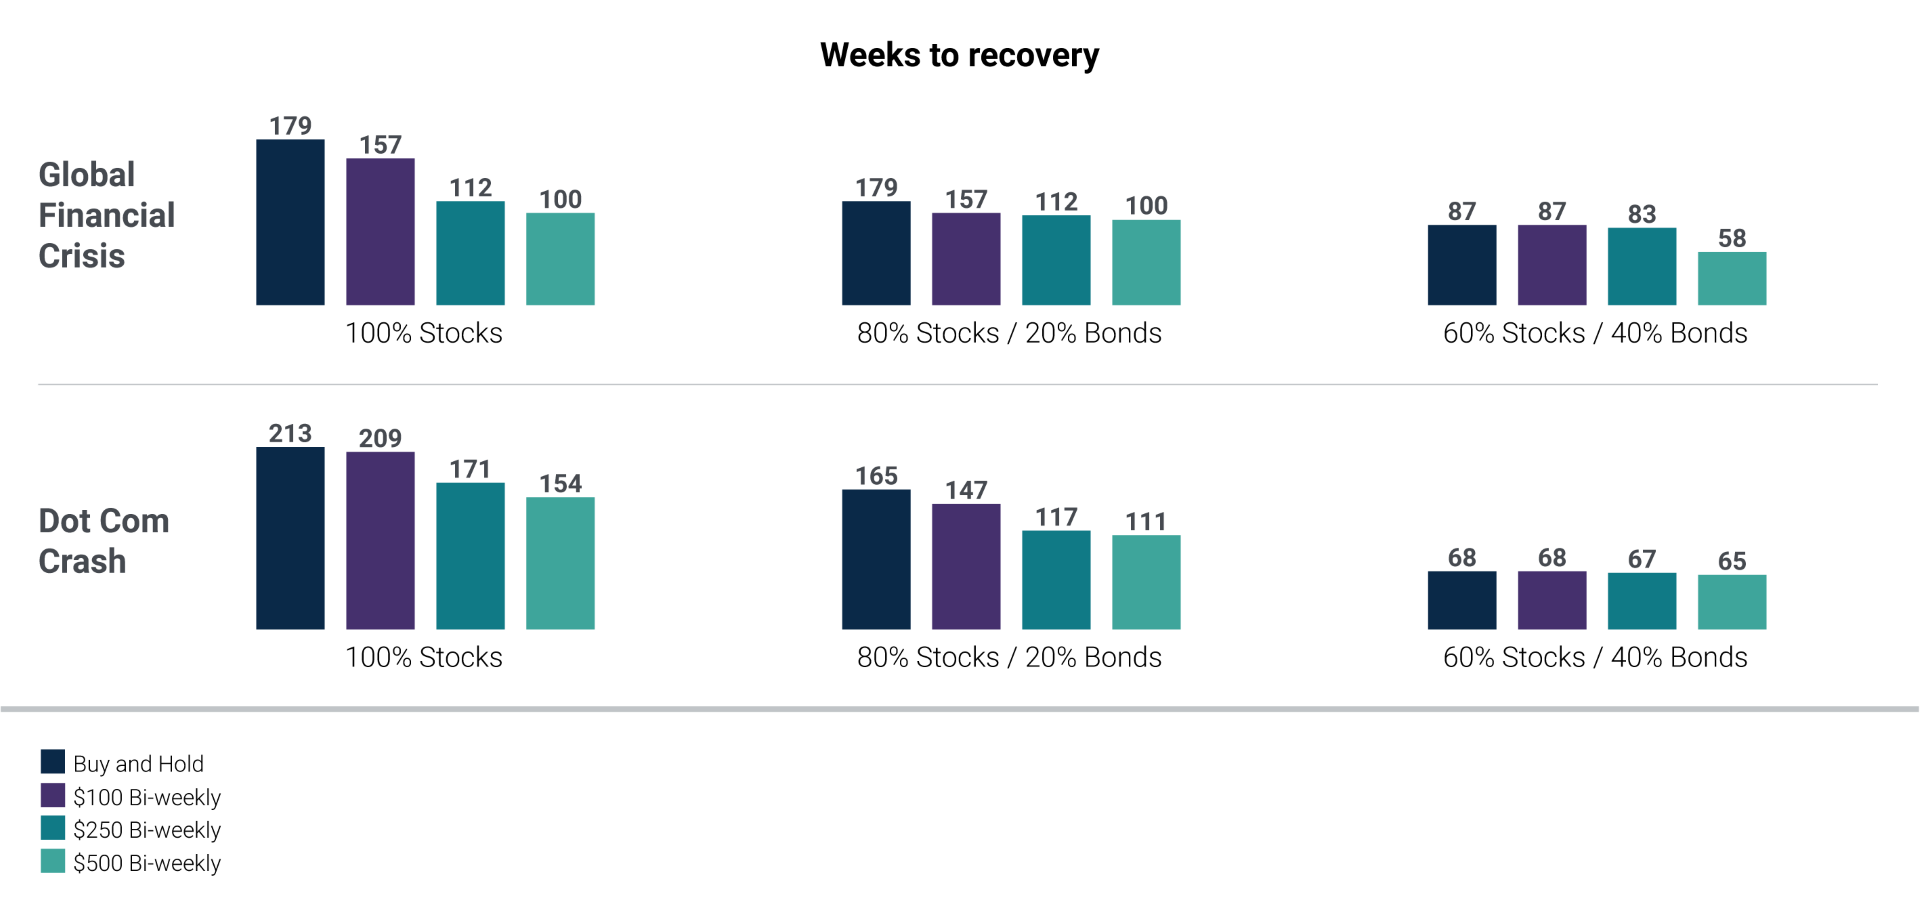
7. Investing through down markets can help portfolios recover faster
Those who not only stay invested but continue to invest during times of market stress can often recover their investments sooner. When you are buying shares at a lower price, you can lower the average cost per share and reduce the risks that come with trying to time the market.
Investing into a diversified portfolio, with an asset allocation that includes both stocks and bonds, can also help reduce the time it takes to recover.
Source: Bloomberg, S&P Dow Jones Indices, American Enterprise Investment Services, Inc. This example is shown for illustrative purposes only and is not guaranteed. Past performance is not a guarantee of future results.
Illustrations assume an initial portfolio of $100,000 invested at market peak, based on weekly data. Stocks are represented using the S&P 500 Total Return Index and Bonds are represented using the Bloomberg Barclays U.S. Aggregate Bond Index.
Buy and Hold indicates how many weeks from market bottom it took the portfolio to recover the initial investment assuming no rebalancing or contributions into the strategy. The remaining strategies include bi-weekly contributions into Stocks in the dollar amounts specified and represent how many weeks from market bottom it took the portfolio to recover both initial investment and additional contributions.
Global Financial Crisis weekly peak is 10/5/2007 and weekly trough is 3/6/2009, Dot Com Crash weekly peak is 9/1/2000 and weekly trough is 10/4/2002.
Learn more: How to navigate market volatility
Get support through every market cycle
While history shows that the market is resilient over the long term, it’s not easy to see declines in your portfolio. If you have questions about your investment strategy, risk tolerance or asset allocation during this time reach out to an Ameriprise financial advisor to discuss.
One of your clients has some questions they would like to discuss with you at your next meeting.
warning Something went wrong. Do you want to try reloading? Try again
When you’re ready to reach out to an Ameriprise financial advisor for a complimentary initial consultation, consider bringing these questions to your meeting.
Reach out to %advisor% to start the conversation.
Or, request an appointment online to speak with an advisor.
At Ameriprise, the financial advice we give each of our clients is personalized, based on your goals and no one else's.
If you know someone who could benefit from a conversation, please refer me.
Background and qualification information is available at FINRA's BrokerCheck website.