What to expect from markets during a midterm election year
Anthony Saglimbene, Chief Market Strategist – Ameriprise Financial
April 1, 2026

This article is intended to provide perspective on how financial markets behave during election years. These insights are not political statements from Ameriprise Financial, nor an endorsement of a particular candidate or political party.
2026 is a midterm election year — what could that mean for your portfolio?
Decades of data show that U.S. stocks often move in predictable ways during midterm election years. These recurring performance patterns are especially evident in the S&P 500 Index, but also reflected in major indexes such as the Dow Jones Industrial Average and the NASDAQ Composite.
Understanding this market behavior can help you make informed investing decisions and stay on track with your long-term financial goals. Below, we examine historical data going back to 1945 and share five common trends that markets exhibit during midterm election years.
1. Stocks tend to deliver lower returns during midterm election years
As investors grapple with political uncertainty and the future makeup of Congress, the stock market tends to deliver below-average returns during midterm election years and higher volatility than in non-election years. Notably, the S&P 500 tends to gain little ground in the initial months of midterm years, especially when compared to its usual upward drift in non-election years.
As our chart below highlights, monthly returns in the S&P 500 can vary throughout the year as investors respond to fundamentals that are far more relevant to growth, profits and interest rates than election dynamics. That said, historically, the S&P 500 tends to perform worse in midterm election years than in non-election years for most of the 12 months, before returning to form heading into year-end once results are known.
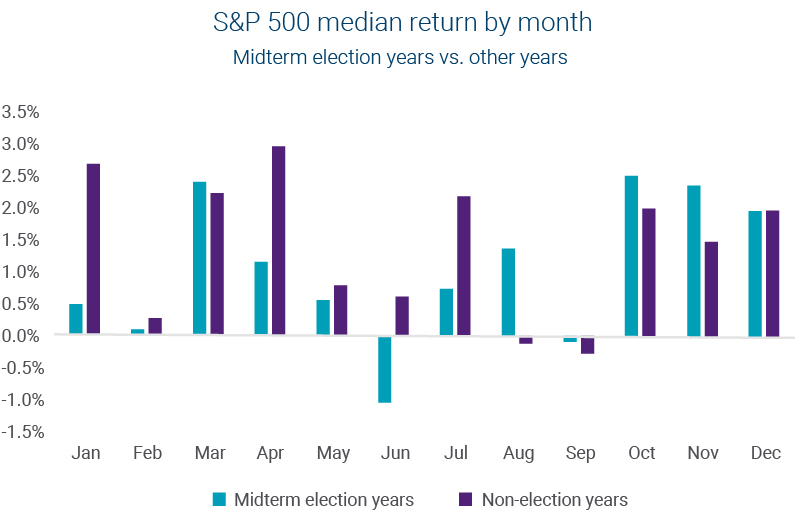
Sources: Bloomberg, S&P Dow Jones Indices. S&P 500 market returns during midterm election years based on calendar month. Midterm election years reflect only years with a midterm election. Non-election years include all years without a midterm or presidential election. Data as of 01/31/2026, beginning with the 1946 midterm election year. This example is shown for illustrative purposes only and is not guaranteed. An index is a statistical composite that is not managed. It is not possible to invest directly in an index. Past performance is not a guarantee of future results.
2. Markets often rebound in the year following the midterms
Once midterm election results are known, the market tends to snap back to its usual trading patterns fairly quickly. In fact, markets often see stronger-than-average returns over the next year, except during periods of unusual financial stress. Notably, the S&P 500 has gained an average of +15.4% one year after a midterm election, going back to 1950, according to Standard & Poor’s data.
As our chart shows below, the S&P 500 has historically seen muted returns on a trailing basis heading into the midterms and higher returns afterwards, as the market responds more favorably to clarity on the makeup of Congress and its implications for fiscal policies.
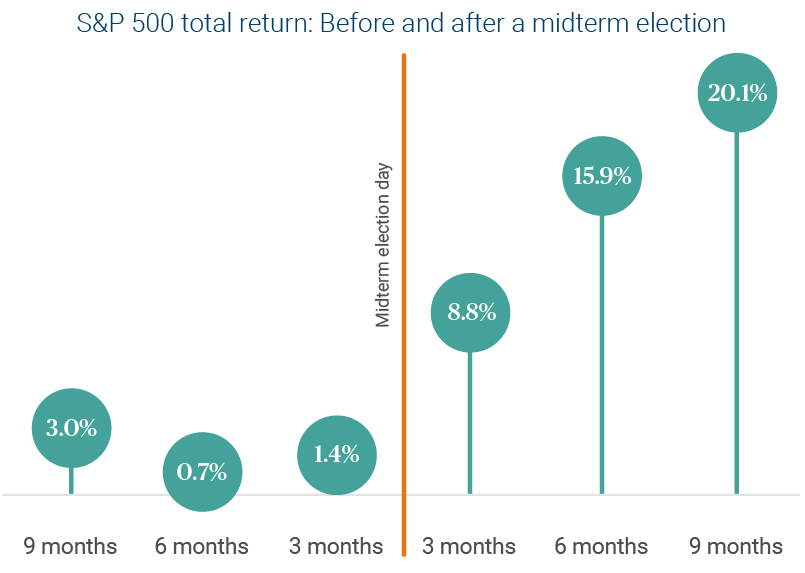
Sources: Bloomberg, S&P Dow Jones Indices. Data as of 1/31/2026 based on calendar months beginning in 1945. Midterm data includes midterms up through 2022. This example is shown for illustrative purposes only and is not guaranteed. An index is a statistical composite that is not managed. It is not possible to invest directly in an index. Past performance is not a guarantee of future results.
Midterm elections don’t just shape the political landscape; they impact financial markets too. Find how stocks typically behave during a midterm election year and learn portfolio positioning strategies to navigate the 2026 election cycle.
3. The presidential cycle can provide clues about market performance
Beyond the midterms, another dynamic investors may want to consider is how returns typically vary across a presidential administration’s four years. Historically, the second year of the president’s first term tends to be the weakest year for market returns, as our chart below shows.
- First year of a presidency: Market returns tend to be strong, driven by the excitement of campaign promises.
- Second year of a presidency: Policies can be difficult to pass through Congress, and the president assumes ownership of the country’s direction at this point, which can lead to a second-year slump as midterm elections play out, particularly in a president’s first term.
- Third year and fourth year of presidency: Presidents can refocus on key priorities and begin building the case for a second term, which tends to be positive for equities.
- Second term of presidency: The president can lean on their experience, which can yield strong results in the first half of their presidency. However, in the final years of the president’s second term, market returns have been historically weaker, in part because investors begin to prepare for the uncertainty of the next administration.
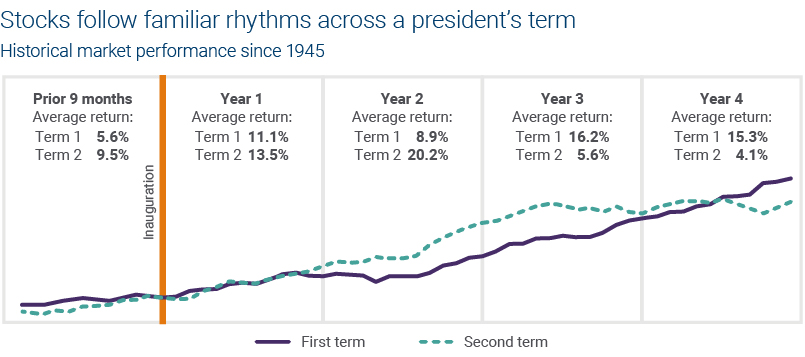
Sources: Bloomberg, S&P Dow Jones Indices. Calculations based on monthly price-return data for the S&P 500 Index are averaged for each presidential administration during the term the president served, using monthly observations. Presidential terms are rounded to the nearest month based on the day the president enters and exits office. Not all presidents finish their terms, and not all serve a second term. Data as of 1/31/2026, beginning in April 1945. This example is shown for illustrative purposes only and is not guaranteed. An index is a statistical composite that is not managed. It is not possible to invest directly in an index. Past performance is not a guarantee of future results.
4. Market volatility typically peaks right before voters cast their ballots
As the election draws closer, investors may want to prepare for the possibility of uncertainty. Market volatility has a record of peaking right ahead of a midterm election, then fading back to more normal levels as the election draws closer, and particularly, after election day.
Although each midterm election cycle occurs amid its own unique market and economic circumstances, there is a common rhythm to the market’s pattern, in which political uncertainty can weigh on stock prices throughout much of the year and until election results are known. That said, barring a major shift in the current market and economic environment, midterm election dips (should they occur) have historically provided investors with a solid buying opportunity ahead of a potential upswing later in the year.
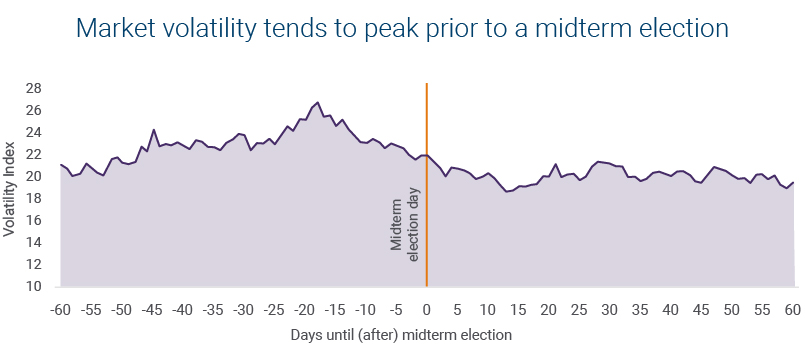
Sources: Bloomberg, Chicago Board Options Exchange Volatility Index. 30-day expected volatility of the S&P 500 Index, 60 trading days prior to elections and 60 trading days after the election. Data begins with the 1992 election cycle and ends with the 2022 election cycle. This example is shown for illustrative purposes only.
5. Stocks tend to rise over the long term (regardless of political outcomes)
Finally, investors would do well to remember that the market generally climbs higher over the long term — regardless of who is in the White House or Congress. And while elections can cause short-term disruption, fundamental factors such as the pace of economic growth, the level of corporate profits and the direction of interest rates ultimately drive longer-term market performance.
Bottom line: While political cycles can sometimes shift the market’s return timeline for a bit, over the long run, broad U.S. equity returns have been strong under various iterations of Congress and presidents, as our chart below demonstrates.
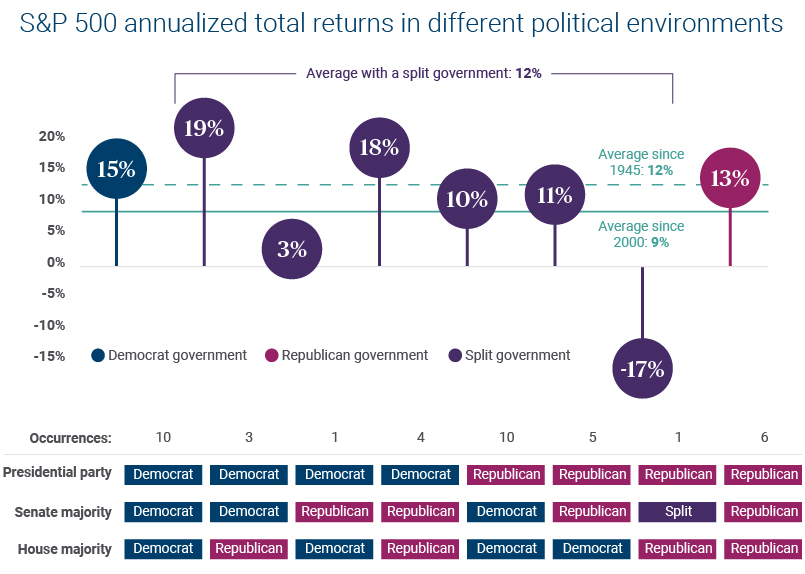
Performance is calculated based on a January – December calendar year. Data as of 12/31/2025, beginning in 1945. Data Source: Bloomberg, S&P Dow Jones Indices. This example is shown for illustrative purposes only and is not guaranteed. An index is a statistical composite that is not managed. It is not possible to invest directly in an index. Past performance is not a guarantee of future results.
How should investors use this information?
The upcoming midterm election is just one of many factors that could influence markets this year. With that in mind, here are a few actions investors should consider as the midterms approach:
- Stay the course with your investment strategy: Use this election data as context to better understand one dynamic that could shape stock prices this year, rather than a reason to shift away from a well-established investment strategy.
- Use any drawdowns to your advantage: Timing the market is extremely difficult to do consistently. However, should any election-induced market volatility arise, consider the benefits of redeploying cash for investment.
- Focus on fundamentals: Prioritize investment strategies that account for the impact of trade, economic growth and artificial intelligence trends, rather than react to election headlines that are bound to intensify throughout 2026.
Don’t let the political noise derail your financial strategy
As the political discourse heats up heading into this year’s midterm elections, markets may temporarily soften. Know that your Ameriprise financial advisor is here to help you navigate any uncertainty that arises and keep you on track with your long-term investment strategy.
Or, request an appointment online to speak with an advisor.
At Ameriprise, the financial advice we give each of our clients is personalized, based on your goals and no one else's.
If you know someone who could benefit from a conversation, please refer me.
Background and qualification information is available at FINRA's BrokerCheck website.
The views expressed are as of the date given, may change as market or other conditions change, and may differ from views expressed by other Ameriprise Financial associates or affiliates. Actual investments or investment decisions made by Ameriprise Financial and its affiliates, whether for its own account or on behalf of clients, will not necessarily reflect the views expressed. This information is not intended to provide investment advice and does not account for individual investor circumstances.
Some of the opinions, conclusions and forward-looking statements are based on an analysis of information compiled from third-party sources. This information has been obtained from sources believed to be reliable, but accuracy and completeness cannot be guaranteed by Ameriprise Financial. It is given for informational purposes only and is not a solicitation to buy or sell the securities mentioned. There is no guarantee that investment objectives will be achieved or that any particular investment will be profitable.
The information is not intended to be used as the sole basis for investment decisions, nor should it be construed as advice designed to meet the specific needs of an individual investor.
Stock investments involve risk, including loss of principal. High-quality stocks may be appropriate for some investment strategies. Ensure that your investment objectives, time horizon and risk tolerance are aligned with investing in stocks, as they can lose value.
Past performance is not a guarantee of future results.
An index is a statistical composite that is not managed. It is not possible to invest directly in an index.
The S&P 500 Index is a basket of 500 stocks that are considered to be widely held. The S&P 500 index is weighted by market value (shares outstanding times share price), and its performance is thought to be representative of the stock market as a whole. The S&P 500 index was created in 1957 although it has been extrapolated backwards to several decades earlier for performance comparison purposes. This index provides a broad snapshot of the overall US equity market. Over 70% of all US equity value is tracked by the S&P 500. Inclusion in the index is determined by Standard & Poor’s and is based upon their market size, liquidity, and sector.
The NASDAQ Composite index measures all NASDAQ domestic and international based common type stocks listed on the Nasdaq Stock Market.
The Dow Jones Industrial Average (DJIA) is an index containing stocks of 30 Large-Cap corporations in the United States. The index is owned and maintained by Dow Jones & Company.
The Chicago Board of Options Exchange (CBOE) Volatility Index® (VIX®) Index is based on real-time prices of options on the S&P 500® Index (SPX) and is designed to reflect investors' consensus view of future (30-day) expected stock market volatility.
Investment products are not insured by the FDIC, NCUA or any federal agency, are not deposits or obligations of, or guaranteed by any financial institution, and involve investment risks including possible loss of principal and fluctuation in value.