Are AI stocks in a bubble? What history suggests
Anthony Saglimbene, Chief Market Strategist – Ameriprise Financial
Oct. 19, 2026

The race to build the AI economy is accelerating. Companies continue to invest billions in chips, data centers and other AI infrastructure, reflecting confidence in the technology's long-term potential. At the same time, investors are asking a tougher question: Will future revenues and profits ultimately justify today's level of spending and market enthusiasm?
That tension between transformative innovation and elevated expectations has revived a familiar debate: Are we in an AI bubble?
It's a fair question, but in our view, a simple yes-or-no answer isn't particularly useful. Rather than trying to predict exactly how the cycle will unfold, history offers a useful framework for understanding the patterns that often emerge when breakthrough technologies capture investors' imagination.
Here's a look at how today's AI boom compares with past bubbles, where the parallels are strongest and why we believe the AI story is more complex than a simple bubble-or-not debate.
What’s a bubble?
In the financial world, a bubble is a period when asset prices become disconnected from their fundamental value, often fueled by speculation and unusually optimistic investor expectations.
It’s important to note that asset bubbles are rare. True full-scale bubbles occur perhaps once or twice every few decades. And while speculative excess is common, bubbles are not.
What are the signs that a bubble may be forming?
Asset bubbles rarely emerge out of thin air. Instead, they often begin with a genuine economic, technological or commercial breakthrough that captures investors' imagination. Over time, however, enthusiasm can outpace fundamentals. Despite differences in timing, geography and asset class, market historians such as Barry Ritholtz have found that major bubbles tend to share a recognizable set of hallmarks.
Here are the six phases of an asset bubble:
-
A genuine technological or commercial innovation provides the foundation.
-
Cheap and abundant capital fuels investment.
-
Leverage and financial engineering amplify the leg higher.
-
A compelling narrative justifies elevated prices, usually a version of the idea that this time is different.
-
Media coverage saturates and normalizes the theme.
-
Herd behavior and broad participation across social classes mark the late innings.
Three additional patterns also show up repeatedly when asset bubbles form:
-
The underlying infrastructure often survives the bubble even when the shareholders financing it incur losses.
-
Equity markets typically peak before physical capex peaks, meaning stocks turn lower before the buildout slows.
-
The collapse is almost always faster than the ascent, with recovery timelines that can span years.
What history tells us
To understand whether today's AI enthusiasm resembles a bubble, it helps to examine how some of history's most notable bubbles developed and ultimately unfolded.
-
Japan's 1980s asset bubble: Cheap credit from the Bank of Japan following the 1985 Plaza Accord fueled speculation across both stocks and real estate. The Nikkei 225 rose from under 7,000 to nearly 39,000 during the decade. At the peak, Japan's equity market capitalization was over two times the country's GDP, according to Bloomberg. It took roughly 34 years for the Nikkei to reclaim its 1989 peak.
-
The 2000s dot-com bubble: This bubble is perhaps the most direct analog for today. The internet was a transformative technology, though the fiber-optic buildout proved too aggressive for demand at the time. The NASDAQ Composite rose roughly sixfold between 1995 and its March 2000 peak, then fell approximately 78% by October 2002. It didn't reclaim its 2000 peak until April 2015. The internet ultimately delivered on its promise, but many of the companies and investors carrying that promise were severely disrupted when the bubble popped.
-
2008 Global Financial Crisis: Cheap credit also drove this bubble, along with financial engineering through mortgage-backed securities and a widely accepted narrative that U.S. home prices would not fall on a national basis. The S&P/Case-Shiller National Home Price Index roughly doubled between 2000 and its 2006 peak, then fell roughly 26%. The S&P 500 Index declined 57% from its October 2007 peak to its March 2009 trough and didn't reclaim its 2007 high until March 2013. Notably, the housing collapse rolled through the banking system, credit markets, and the real economy.
Are we in an AI bubble today?
To answer that question, let’s compare today’s AI cycle against the same six bubble patterns discussed above. Viewed through the lens of history's most notable bubbles, today's AI cycle exhibits many familiar characteristics, though not all are present to the same degree.
-
Innovation: AI is unambiguously transformative. Enterprise adoption is accelerating, and AI-related revenue growth at major hyperscalers is already measurable.
-
Capital: While interest rates remain elevated, capital remains readily available. Public debt markets, private credit and corporate spending continue to fund AI infrastructure buildouts.
-
Leverage: Present, but not yet extreme. Large debt issuances and growing private-credit participation suggest leverage is increasing across the ecosystem.
-
Narrative: The idea that "AI will transform every industry" has become one of the market's dominant investment themes.
-
Media attention: AI now commands near-constant coverage across business media, earnings calls and industry events.
-
Broad participation: The top 10 names in the S&P 500 Index are now approaching 40% by market-cap weight, and all are AI-related. That level of concentration means most diversified portfolios already carry heavy AI exposure, whether investors intended it or not.
Taken together, today's AI cycle appears to display at least four of the six hallmarks commonly associated with past asset bubbles. The key question is whether future AI revenues and profits ultimately justify today's level of investment and market enthusiasm.
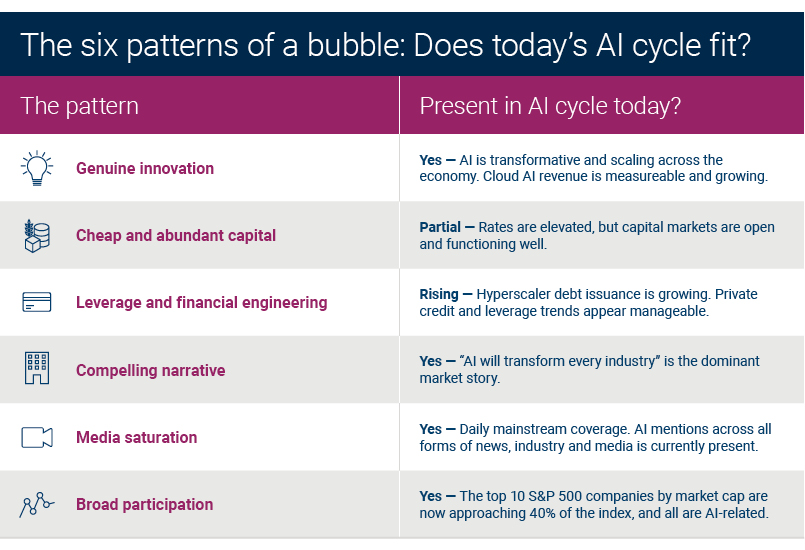
Source: American Enterprise Investment Services, Inc.
How can investors prepare for a potential AI bubble?
Even when knowing the hallmarks of a bubble, timing the pop is nearly impossible and investors seldom accurately identify a bubble in real time, even when strategists like us are doing our best forecasting exercises.
We recommend investors start with one simple question right now: If my portfolio dropped 10%, 20%, 30% or more, would I be comfortable with how I’m positioned and what I own today?
-
Start with your time horizon. An investor with a 5-year time horizon should approach today’s market risks more guardedly than one with a 15+ year horizon. For example, if you’re near or in retirement, maintaining a cash reserve or other liquid assets can help cover short-term spending needs and reduce the likelihood of having to sell investments during a market downturn. Building these positions when times are good (like now), not when markets are faltering, is key.
-
In tax-advantaged accounts, consider rebalancing more frequently. Concentration risks often build in a rapidly expanding market environment, and when generational themes are present. If AI-heavy names have pushed allocations meaningfully above strategic thresholds, rebalancing back to targets more frequently than once a year can help mitigate risk.
-
Diversify, diversify, diversify. Smaller-capitalization stocks, international equities, dividend payers, defensives, bonds, cash and alternatives can all help insulate portfolios from a potential AI-driven drawdown.
-
Reframe your measure of investment success. In our view, most investors are well served by participating in market gains rather than by chasing outperformance. We believe diversification and risk-mitigation strategies, which your Ameriprise financial advisor is well-equipped to help you with, can help increase your confidence, providing a proactive approach to scenarios history tells us occur over time. But there’s a trade-off. Diversification underperforms when growth leadership dominates. But the alternative, concentrated exposure held all the way through a potential bubble unwind, combined with poor timing behaviors that follow, has costs that most investors seldom can afford to incur.
Bottom line
To be clear, we don’t believe the AI investment cycle will end any time soon, and there could be years of asset growth in the future. The technology is transformative (and young), demand is real and the earnings evidence continues to support the theme.
While we believe further stock upside from here is more likely than not, every prior bubble looked defensible on fundamentals until it didn't. Importantly, the bubble patterns showing up today in the AI cycle are the same ones that usually show up in prior bubbles. The value of history is not in predicting the timing of the bubble’s burst. It's about preparing for a range of possible outcomes in advance, including ones that aren’t all positive.
Investors who can smartly diversify around big secular cycles, who anchor on time horizon/risk, and who rebalance and diversify with discipline are usually the investors who compound wealth across time. Simply, focus on the elements within your control and have a plan for a bear market, even if the current bull market has more room to run.
Prepare for the expected and unexpected
History shows that market cycles rarely unfold exactly as investors expect. An Ameriprise financial advisor can help you prepare for a range of outcomes while keeping your investment portfolio on track.
Or, request an appointment online to speak with an advisor.
At Ameriprise, the financial advice we give each of our clients is personalized, based on your goals and no one else's.
If you know someone who could benefit from a conversation, please refer me.
Background and qualification information is available at FINRA's BrokerCheck website.
The views expressed are as of the date given, may change as market or other conditions change, and may differ from views expressed by other Ameriprise Financial associates or affiliates. Actual investments or investment decisions made by Ameriprise Financial and its affiliates, whether for its own account or on behalf of clients, will not necessarily reflect the views expressed. This information is not intended to provide investment advice and does not account for individual investor circumstances.
Some of the opinions, conclusions and forward-looking statements are based on an analysis of information compiled from third-party sources. This information has been obtained from sources believed to be reliable, but accuracy and completeness cannot be guaranteed by Ameriprise Financial.
This article is given for informational purposes only and is not a solicitation to buy or sell the securities mentioned. The information is not intended to be used as the sole basis for investment decisions, nor should it be construed as advice designed to meet the specific needs of an individual investor. Please seek the advice of a financial advisor regarding your particular financial situation.
Diversification does not assure a profit or protect against loss.
Stock investments involve risk, including loss of principal. High-quality stocks may be appropriate for some investment strategies. Ensure that your investment objectives, time horizon and risk tolerance are aligned with investing in stocks, as they can lose value.
The products of technology companies may be subject to severe competition and rapid obsolescence, and their stocks may be subject to greater price fluctuations.
An index is a statistical composite that is not managed. It is not possible to invest directly in an index.
Definitions of individual indices and sectors mentioned in this article are available on our website at ameriprise.com/legal/disclosures in the Additional Ameriprise research disclosures section.
The S&P 500 Index is a basket of 500 stocks that are considered to be widely held. The S&P 500 index is weighted by market value (shares outstanding times share price), and its performance is thought to be representative of the stock market as a whole. The S&P 500 index was created in 1957 although it has been extrapolated backwards to several decades earlier for performance comparison purposes. This index provides a broad snapshot of the overall US equity market. Over 70% of all US equity value is tracked by the S&P 500. Inclusion in the index is determined by Standard & Poor’s and is based upon their market size, liquidity, and sector.
S&P/Case-Shiller National Home Price Index: A widely used measure of U.S. residential real estate prices that tracks changes in the value of existing single-family homes across the nation.
Investment products are not insured by the FDIC, NCUA or any federal agency, are not deposits or obligations of, or guaranteed by any financial institution, and involve investment risks including possible loss of principal and fluctuation in value.
Securities offered by Ameriprise Financial Services, LLC. Member FINRA and SIPC.