Annual Report 2017


2017 Ameriprise Financial Consolidated Highlights
(in millions, except per share and as noted)
| GAAP | 2017 | 2016 | 2015 |
|---|---|---|---|
| Net revenues | $12,027 | $11,696 | $12,170 |
| Net income attributable to Ameriprise Financial | $1,480 | $1,314 | $1,562 |
| Earnings per diluted share attributable to Ameriprise Financial common shareholders | $9.44 | $7.81 | $8.48 |
| Return on equity excluding accumulated other comprehensive income, net of tax | 24.8% | 20.4% | 21.5% |
| Shareholders' equity | $5,998 | $6,292 | $7,191 |
| Shareholders' equity excluding accumulated other comprehensive income, net of tax | $5,769 | $6,092 | $6,938 |
| 2017 | 2016 | 2015 | |
|---|---|---|---|
| Assets under management and administration (in billions) | $897 | $787 | $777 |
| Weighted average common shares outstanding — diluted | 156.7 | 168.2 | 184.2 |
| Cash dividends paid per common share | $3.24 | $2.92 | $2.59 |
| Common stock shares repurchased | 9.9 | 17.6 | 13.9 |
| Operating 1,2 | 2017 | 2016 | 2015 |
|---|---|---|---|
| Net revenues | $11,888 | $11,535 | $11,734 |
| Adjusted net revenues* | $11,939 | $11,535 | $11,734 |
| Earnings | $1,603 | $1,427 | $1,716 |
| Adjusted earnings* | $1,923 | $1,427 | $1,716 |
| Earnings per diluted share | $10.23 | $8.48 | $9.32 |
| Adjusted earnings per diluted share* | $12.27 | $8.48 | $9.32 |
| Return on equity excluding accumulated other comprehensive income, net of tax | 26.9% | 22.2% | 24.3% |
| Adjusted return on equity excluding accumulated other comprehensive income, net of tax* | 32.3% | 22.2% | 24.3% |
* Adjusted operating results exclude a one-time, primarily non-cash, negative estimated impact of $320 million in 2017, primarily related to a reduction in future tax benefits associated with the enactment of the Tax Cuts and Jobs Act.
1 This Annual Report to Shareholders contains certain non-GAAP financial measures that management believes best reflect the underlying performance of our operations. Reconciliations of non-GAAP measures to the most directly comparable GAAP measure are below.
2 Results include the non-cash impact of unlocking, which reflects the company’s annual review of market-related inputs and model changes related to our living benefit valuation, insurance and annuity valuation assumptions relative to current experience and management expectations, and premium deficiency testing. To the extent that expectations change as a result of this review, the company updates its assumptions and models and the impact is reflected as part of annual unlocking.
Dear fellow shareholders,
At Ameriprise, the strength and longevity of our client relationships differentiates us. Our clients entrust us to help grow, manage and protect their wealth. And we manage our company with the same approach we take to deliver value for all our constituents — with a prudent, long-term plan and our values at the forefront.
2017 was a terrific year for Ameriprise. We continued to earn excellent client satisfaction and leading employee engagement in the financial services industry and generated record financial results. Proudly, Ameriprise was recognized in the investment industry for our customer service, loyalty and trust, and our investment performance. This recognition reinforces that our clients are at the center of all we do.
(Continued below)

James M. Cracchiolo
Chairman and Chief Executive Officer
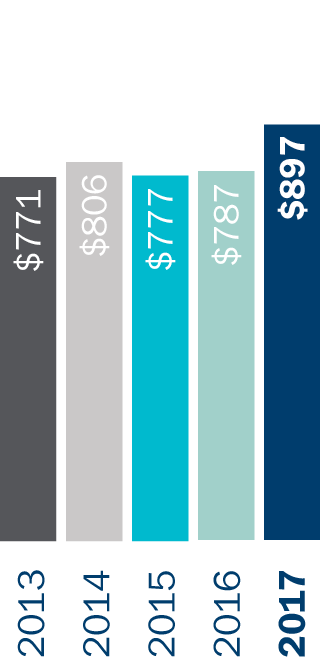
Assets under management and administration
$ in billions
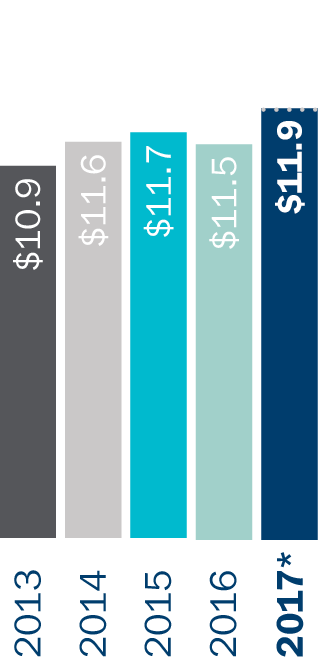
Adjusted operating net revenue
$ in billions
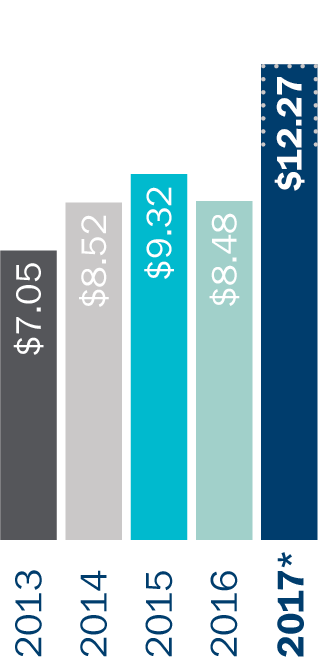
Adjusted operating earnings per diluted share
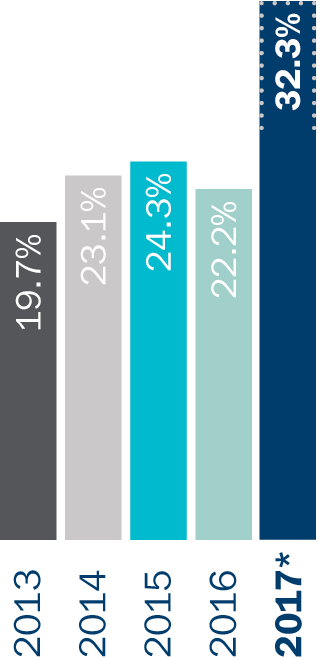
Adjusted operating return on equity ex. AOCI
1 Accumulated other comprehensive income
* Excludes a one-time, primarily non-cash impact of the Tax Cuts and Jobs Act
2017: a year of growth and momentum
The year began with regulatory and geopolitical uncertainty. However, better economies globally and the pro-growth agenda in Washington boosted both financial markets and investor sentiment. U.S. equity markets increased nicely, and in anticipation of stronger economic growth, the U.S. Federal Reserve increased short-term interest rates. In addition, in late December, the Tax Cuts and Jobs Act became law, reducing corporate tax rates to enhance U.S. competitiveness globally.
With this backdrop, Ameriprise generated record results that reflect our consistent growth investments, our disciplined management approach and an improved operating environment. Assets under management and administration reached an all-time high of $897 billion, up 14% from the prior year.
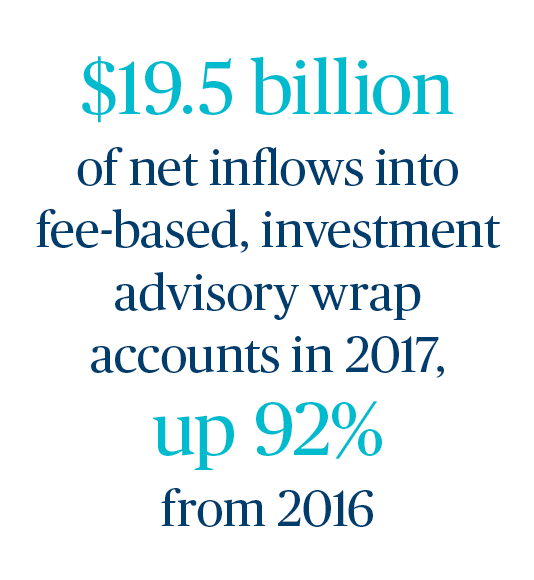
Client net inflows into fee-based, investment advisory “wrap” accounts nearly doubled to $19.5 billion, and we continued our longstanding trend of generating leading advisor productivity.
On an adjusted operating basis (excludes a one-time, primarily non-cash $320 million charge resulting from the Tax Cuts and Jobs Act and includes the result of our annual review of insurance and annuity valuation assumptions “unlocking”):
Net revenues increased 4% to $11.9 billion, or 5% reflecting the net impact of our 12b-1 fee change
Earnings increased 35% to $1.9 billion with operating earnings per diluted share up 45% to $12.27 and
Return on equity, excluding accumulated other comprehensive income, grew 1,010 basis points to 32.3%
Investors took notice:
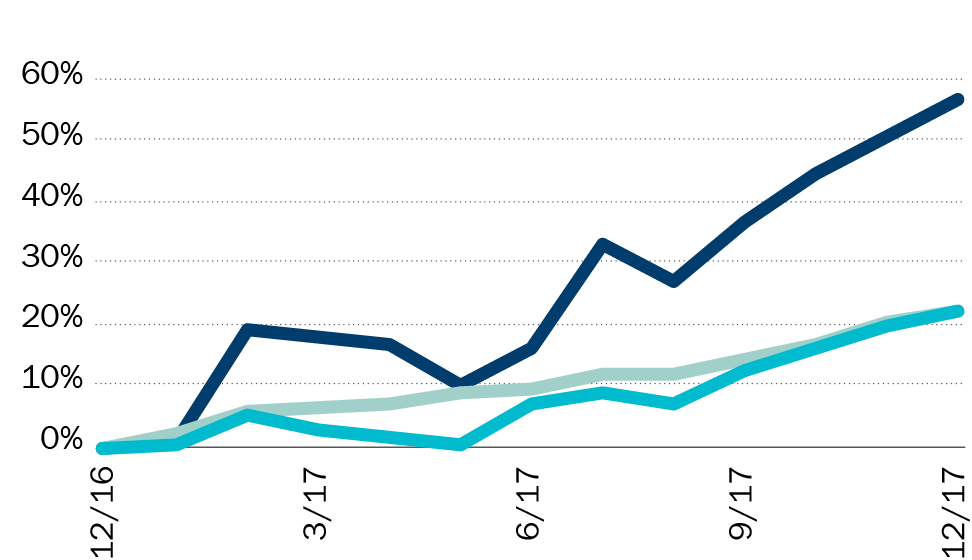
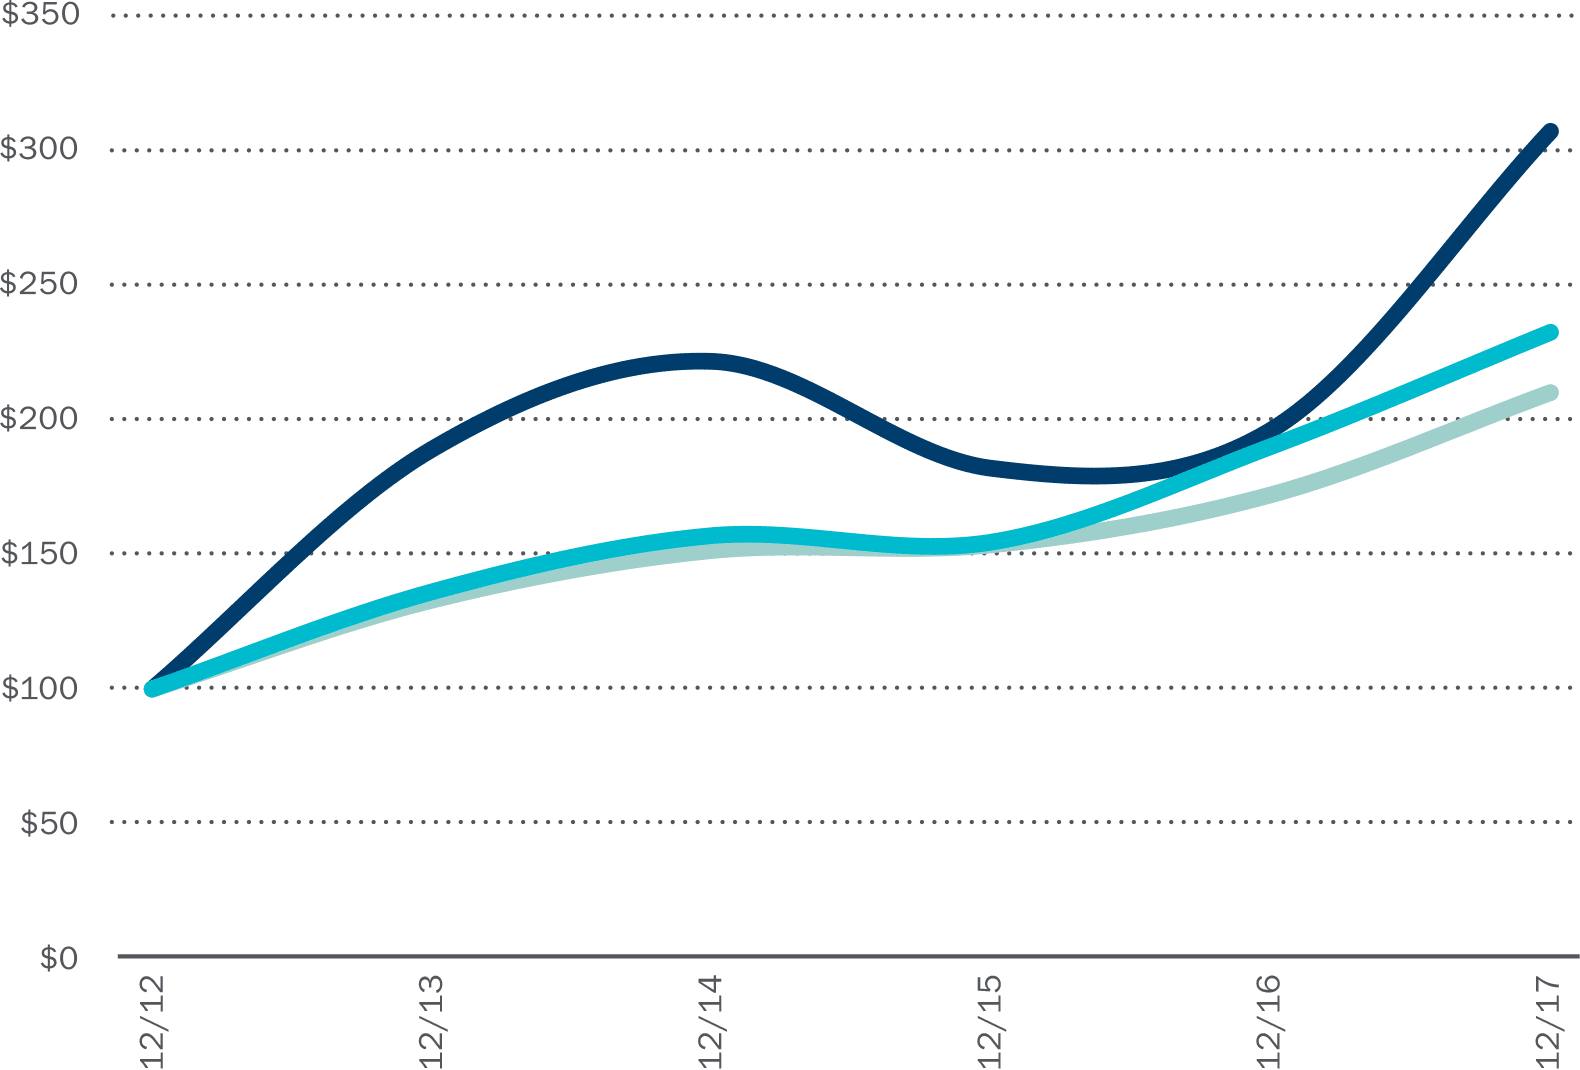
The total return of Ameriprise Financial common stock was 56% in 2017, the fifth-best return of the 66 firms in the S&P 500 Financials Index and the third-largest one-year increase since we became an independent, public company in 2005.
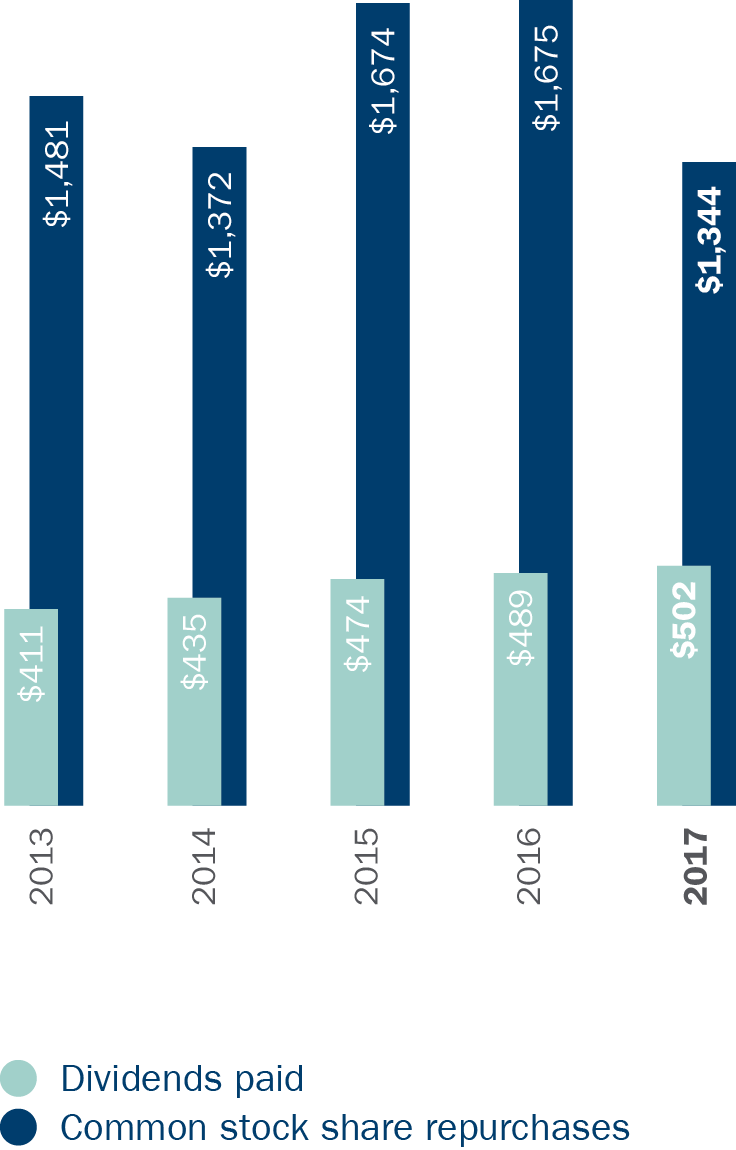
This included an 11% increase in our quarterly dividend — our tenth increase in eight years — and $1.3 billion in share repurchases.
In total, we returned 96% of our 2017 adjusted operating earnings to shareholders.
“Ameriprise generated record results that reflect our consistent growth investments, our disciplined management approach and the improved operating environment.”
We remain focused on both near- and long-term value creation. Working closely with the Ameriprise Board of Directors, we work to ensure that our strategic plan is balanced, takes the dynamic operating environment into account and enables us to invest for long-term growth.
In fact, if you are a long-term shareholder and have owned Ameriprise common stock since 2005, your total return was 504% at the end of 2017. This is about 10 times the return of the S&P 500 Financials Index over the same time and the second-best return in the index overall.
We’re proud of our consistent record of delivering value for our clients, advisors, employees and shareholders and the leading positions we’ve built in U.S. wealth management and global asset management. And we’re positioned well to build on our momentum.
Ameriprise Financial Common Stock Total Shareholder Return — 2017
Ameriprise Financial Common Stock Total Shareholder Return — Sept. 2005*-2017
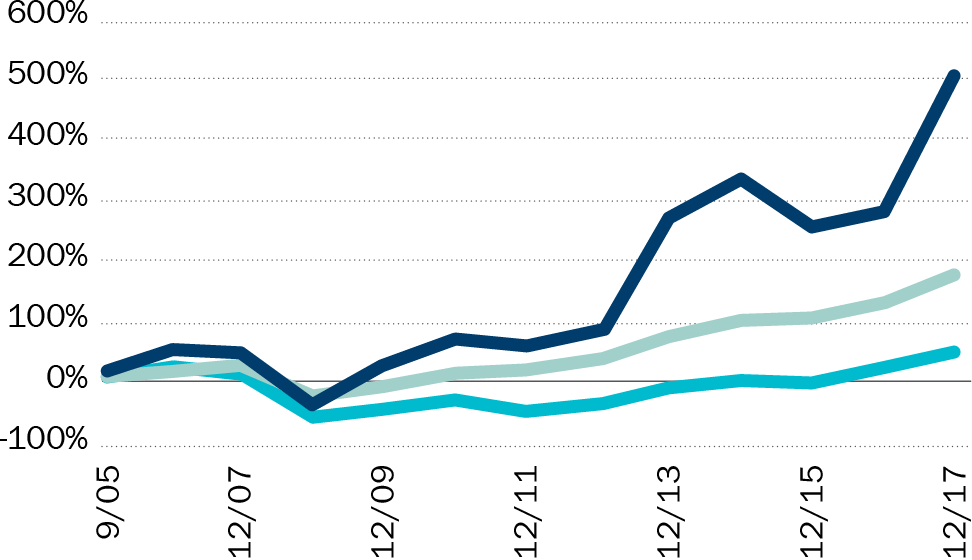
Ameriprise Financial, Inc.
S&P 500 Index
S&P 500 Financials Index
*Ameriprise Financial became an independent, public company on September 30, 2005
See below for index definitions
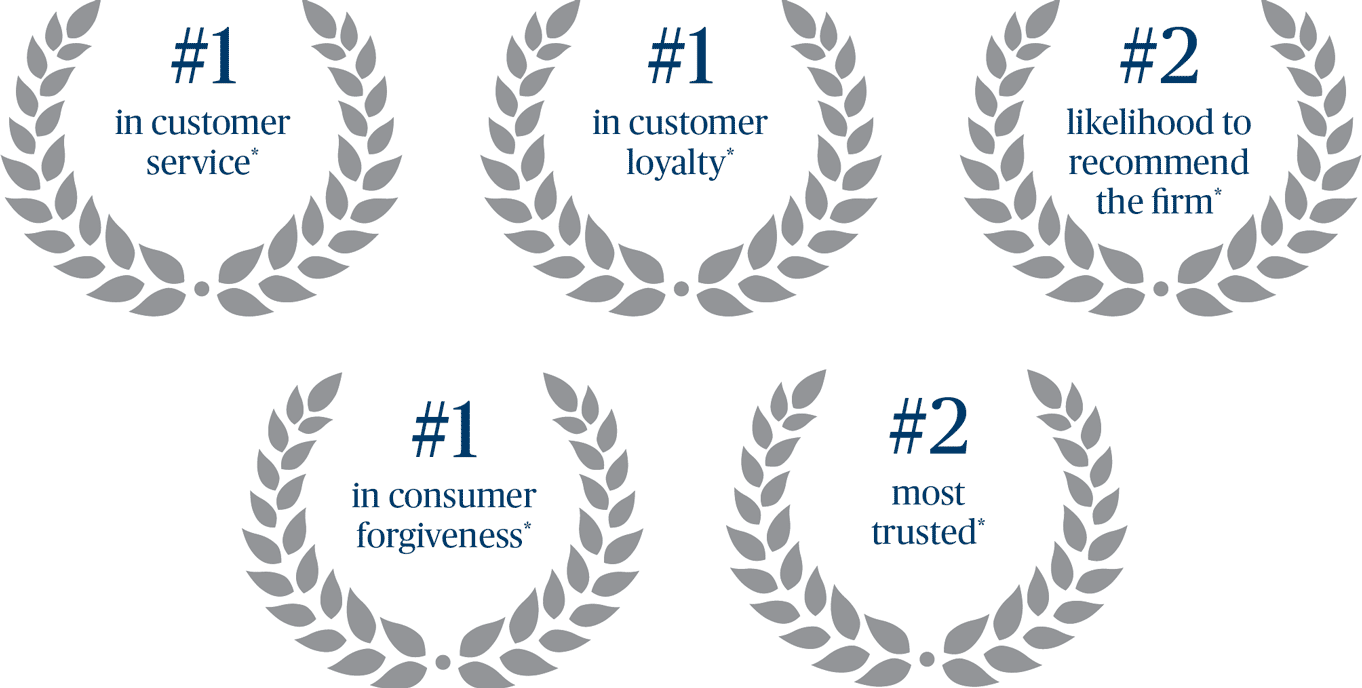
Ameriprise Financial — a top performer in the investment industry
* See below for source information
Advice & Wealth Management: a key driver of our growth
Our Advice & Wealth Management business is one of the largest in the nation. Ameriprise is the leader in financial planning in the U.S. with more Certified Financial PlannerTM professionals than any other firm, a position we’ve proudly earned and maintained for years. Our clients look to us for financial advice and guidance on one of the most important aspects of their lives — their financial security. We help address their financial needs across market cycles and their lifetimes. The personal connection between clients and their advisors, and our long-term focus on serving client needs, differentiates Ameriprise in the marketplace.
We know from our extensive consumer research that people at all life stages are seeking peace of mind, to know their assets are protected and they’re on track to achieve their financial goals. Key to our strategy is growing our retail assets and client base by serving more investors, including those with investable assets in the $500,000 to $5 million range who are a strong fit for our advice value proposition. This is a significant growth opportunity for Ameriprise.
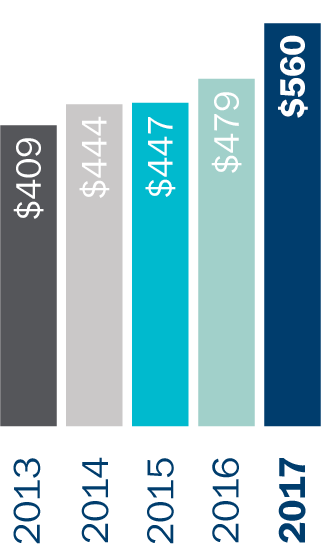
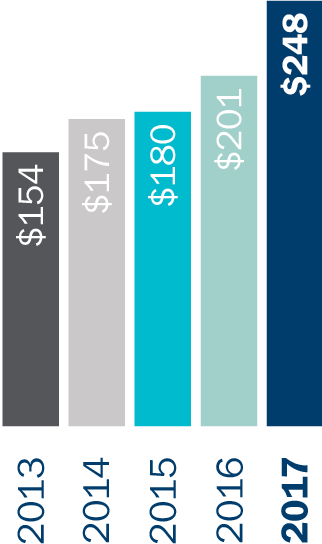
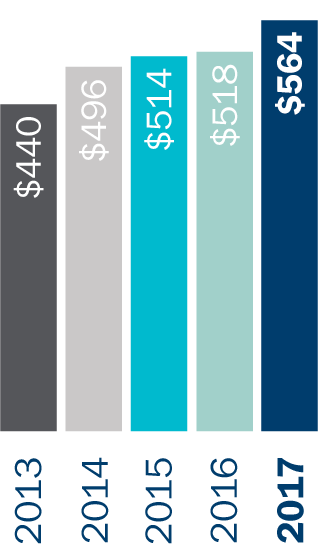
With strong markets and engaged, productive advisors, Ameriprise client assets grew significantly in 2017 — up 17% to $560 billion, an all-time high. We’re also attracting new clients and experiencing good growth in clients with assets above $1 million.
Our advice value proposition delivered through our comprehensive Confident Retirement® approach is key to our clients’ success. We know this approach makes a meaningful difference for the clients who receive it, works well across all life stages and helps our advisors deliver distinct value for an appropriate fee. In fact, of those who experience it, 94% percent feel that the advice they received addressed their needs.
“Our clients look to us for financial advice and guidance on one of the most important aspects of their lives — their financial security. We help address their financial needs across market cycles and their lifetimes.”
To complement our personal approach and meet the evolving needs of multiple generations, we continue to invest and advance our digital, mobile and online capabilities. This includes further digitally enabling our advice experience and enhancing goal and performance tracking for clients and their advisors to understand their progress.
Importantly, information security remains a top priority and we continually invest in the people, processes and tools to safeguard our clients’ information and the firm through a multi-layered approach.

A powerful reputation in the marketplace
Our client experience is essential to our strong reputation. It sets us apart in the industry. In 2017, Ameriprise earned the following important awards:
#1 in customer service
#1 in customer loyalty
#2 in likelihood to recommend the firm
#1 in consumer forgiveness (likelihood of a client to forgive a firm if the firm made an error)
#2 most trusted
We continue to invest in our advice value proposition and the Ameriprise Financial brand. Ameriprise is highly trusted and relevant, and awareness of the Ameriprise brand reached an all-time high in 2017. Our Be Brilliant.® advertising platform continues to tell the Ameriprise story in the marketplace through national TV, digital channels and social media.
Our advisor force is powerful and productive. We consistently earn high advisor satisfaction, and Ameriprise advisors have increased productivity at a higher rate than our wealth management peers for many years. In 2017, our advisors reached a new high in productivity with operating net revenue per advisor increasing 13%, excluding the net impact of our 12b-1 change.
With the strength of our advisor value proposition, Ameriprise is an attractive destination for high-quality advisors who want to serve clients with financial advice and grow their practices. 2017 was one of our best advisor recruiting years in terms of both quantity and productivity: We welcomed another 366 advisors to Ameriprise.
During the year, we also acquired Investment Professionals, Inc., an independent broker-dealer specializing in the on-site delivery of investment programs for banks, credit unions and other financial institutions. This is a new channel for Ameriprise to reach more consumers and complements our wealth management strength.
With significant growth in client assets and flows and effective expense management, we delivered very strong financial results in Advice & Wealth Management that represented 41% of our pretax operating earnings* in 2017.
Segment revenues grew 14%, adjusting for the net impact of the 12b-1 change. In addition, pretax operating margin grew substantially, up 300 basis points, ending the year at a very competitive 21.1%.
“With significant growth in client assets and flows and effective expense management, we delivered very strong financial results in Advice & Wealth Management that represented 41% of our pretax operating earnings in 2017.”
* Excludes Corporate & Other segment
Ameriprise retail client assets
$ in billions
Client assets in fee-based wrap accounts
$ in billions
Operating net revenue per advisor
$ in thousands
RiverSource® Insurance and Annuities: the life, health and annuity businesses of Ameriprise play important roles
As clients build wealth and enter retirement, two priorities become paramount: protecting their hard-earned assets and creating income streams throughout retirement. We’ve built our annuity and insurance businesses over decades to help clients generate lifetime retirement income, while protecting their assets and income. In this persistently low interest rate environment, the businesses are performing within expectations, and we’re benefiting from both the quality of our solutions and disciplined risk management.
Our focus in Insurance and Annuities remains on prudent growth over time as part of our diversified business. These solutions help deepen relationships with clients and contribute to our high client satisfaction and retention. We value the benefits these businesses provide and have strategically limited distribution to Ameriprise clients. As such, we devote considerable time to making it easier for our advisors and clients to incorporate RiverSource insurance and annuity solutions into their comprehensive financial plans, as appropriate. In 2017, that included enhancing our digital capabilities and accelerating insurance underwriting with robust data and risk metrics.
Given that many of our products have fee-based components, we had solid asset growth from equity market gains in 2017. In terms of sales, while we’re seeing good sales of variable annuities without living benefits, total variable annuity sales declined as they have with other providers, given advisors’ increased use of fee-based platforms. We also introduced our first fixed index annuity late in the year to further build out our product line. And in insurance, we had solid sales growth in variable universal life and universal life products.
Additionally, we continue to make progress in our direct property-casualty insurance business. Ameriprise Auto & Home is an affinity-based business recognized for its excellence in customer satisfaction. In recent years, we have significantly improved the underlying financial performance of the business. While record weather-related losses in 2017 impacted our results along with the rest of the industry, the actions we’re taking are making a difference. We continued to increase rates as well as the sophistication of our pricing, tightened underwriting standards, improved claims handling and streamlined the affinity partners we serve. We are seeing solid results and focused on maintaining our momentum.
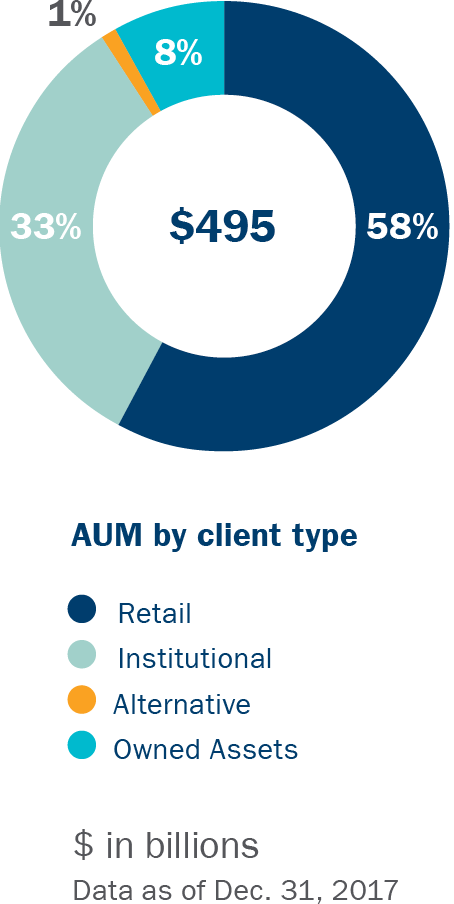
Global Asset Management
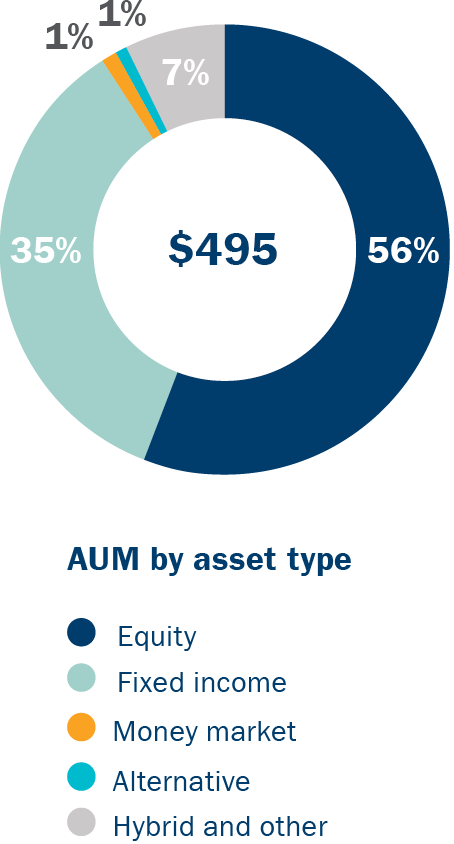
Assets Under Management
Building a global asset management business and delivering strong financial results
There is a sizable long-term opportunity for Ameriprise in asset management. The industry is growing and expected to expand significantly over the next several years. Through our consistent investment and strategic initiatives, we’ve grown our asset management business — Columbia Threadneedle Investments — into a top global firm with high-performing product lines and a growing global reach.
In 2017, Asset Management assets under management grew 9% to $495 billion as equity market appreciation offset net outflows. With solid asset growth and good expense management, we delivered strong, competitive financial results while managing a significant regulatory-driven change agenda. At the same time, we continued to invest in the critical capabilities to drive future growth — including our people, capabilities, reputation and infrastructure.
Key to our success is generating consistent, competitive investment performance to individual investors and sophisticated institutions, including firms with whom we have established important strategic relationships.
We are an active manager, and our investment teams in the U.S., London and Singapore continue to be recognized. We earned more than 50 awards in 2017, including Multi-Asset Manager of the Year at the Professional Pensions Investment Awards in London. At year-end, about 70% of our funds — equities, fixed income and asset allocation — were above Lipper® medians or benchmarks for the 1-, 3- and 5-year timeframes. This strong performance is reflected in the 114 four- and five-star Morningstar-rated Columbia and Threadneedle funds® we offer globally.*
In addition to delivering consistently competitive investment performance, we advanced our multi-year project to move our operating platform to a single global model. We also focused on meeting regulatory requirements of MiFID II and the U.S. Department of Labor (DOL) fiduciary rule, while preparing for the ongoing uncertainty of the Brexit transition. We are managing regulatory change well while competing to serve more clients globally.
As we compete globally, we’re focused on gaining a greater share of retail markets in the U.S., UK, Continental Europe and Asia Pacific, as well as transitioning our global institutional business to become a Tier 1 player.
In retail, though we experienced overall net outflows in the U.S., we improved net sales of our mutual funds at our top firms. As advisors serve more clients in advisory relationships, we’re focused on providing our intermediary clients with model portfolios, multi-asset solutions and adaptive risk strategies. Importantly, we returned to retail net inflows in EMEA, a key region for us, driven by increased net sales of multi-asset and other solutions in the UK.
In the institutional business, given the large size of mandates, annual results can vary significantly, and we experienced outflows from a large sovereign client, as well as low fee insurance and other fixed income mandates. That said, we continue to see good interest in fixed income, multi-asset and risk-aware strategies, and we are working to finalize our won-not-funded business and convert our overall pipeline.
To serve more clients, we are investing to strengthen awareness of the Columbia Threadneedle Investments brand and our digital and business intelligence capabilities, as well as expanding product offerings in strategic beta in the U.S. and responsible investment globally.
In addition, we continue to acquire businesses with complementary capabilities, consistent with our strategy. In 2016, we added Emerging Global Advisors, which enhanced our ETF and strategic beta capabilities. And in 2017, we acquired Lionstone Investments, a leading U.S. real estate investment firm that broadens our offerings in alternatives, complementing our strength in UK property. Lionstone further enhances our multi-asset capabilities and added $5.4 billion in AUM. We will continue to look at complementary capabilities both in terms of investment acumen and distribution.
Overall in Asset Management, we’re taking a thoughtful approach to ensure we deliver for investors today and position ourselves for growth in the future.
* See below for disclosure information

114 4- and 5-star
Morningstar-rated funds, globally*
50+ awards globally
in 2017
Multiple Lipper Awards
U.S., Europe and Asia
Best Equities Fund Manager
Focus Money, Germany
ESG Asset Manager of the Year
Pensioni e Welfare Italia, Italy
* See below for disclosure information
A large opportunity to help more people and institutions reach their goals
As wealth expands around the world, we’re energized about our opportunity to capture more of the large and growing demand for personal advice and tailored investment solutions. In the U.S., our target market has grown significantly, and the largest wealth transfer in history will take place in the coming years. Generation X is also an important part of our client base, and millions more of this generation are looking to be served. And we know from our research that Millennials want to be served by a person — someone who cares about their financial future in a relationship that is supported and enabled by technology.
Whether you are an individual or institutional investor in the U.S., Europe, Asia and other markets, you have similar financial goals, and the consistency of return compared to expectation is essential.
We also remain focused on effectively managing the evolving global regulatory environment. We work diligently to adhere to regulatory changes and inform the debate. That includes the DOL fiduciary rule in the U.S. that has been a priority for multiple administrations and the industry.
In addition, we’re pleased with the outcome of tax reform changes that make the U.S. more competitive in the global marketplace. For Ameriprise, this change resulted in the charge noted earlier, but over the long-term, we believe it’s a positive and will provide additional flexibility as we continue to execute our strategy and deliver for all our stakeholders — clients, advisors, employees and shareholders.
We’re poised to excel in this environment and significantly grow our fee-based businesses. Markets and economies are always changing. What doesn’t change is our approach — it’s personal, comprehensive and grounded by our financial strength and client commitment. Equity market volatility returned in early 2018, which reinforces the importance of our value proposition and what we do for clients.
Differentiated financial strength and capital return
Dividends/share repurchases
$ in millions
- Excess capital
- Strong ratings and risk management
- High-quality investment portfolio
- Ample liquidity
A culture of engagement and giving back
An industry leader in employee engagement and leadership effectiveness
“Best Place to Work” by the Minneapolis-St. Paul Business Journal — for the eighth time
100% rating on the Corporate Equality Index by the Human Rights Campaign for the twelfth consecutive year as a “Best Place to Work” for LGBTQ equality
Recognized as a Yellow Ribbon Company by the state of Minnesota for our military support as well as a Military Friendly® Employer for the third consecutive year
Our values
Client focused
Integrity always
Excellence in all we do
Respect for individuals and for the communities in which we live and work
Corporate giving
In 2017, Ameriprise awarded 192 grants to nonprofits in the U.S. that support our three strategic philanthropic priorities — meeting basic needs, supporting community vitality and volunteer-driven causes. Our grantmaking goes well beyond a financial donation.
Supporting volunteerism
Giving back is part of our culture and values. In 2017, our employees and advisors demonstrated their steadfast commitment to volunteerism by dedicating 77,000 hours of their time working at nonprofits across the U.S. Employees outside the U.S. also are engaged volunteers and joined U.S.-based efforts on key projects throughout the year.
Many of our advisors and employees serve on nonprofit boards, volunteer with our grantees and share their skills. Each quarter, we recognize our top 50 volunteers and contribute $250 to the nonprofit where the employee, advisor or staff member volunteers.
Employee and advisor gift matching, giving campaign
Our people give generously through Ameriprise — 75 percent of corporate employees made donations to nonprofits of their choice. Engagement in the campaign significantly surpassed the U.S. participation average of 35 percent at companies with workplace giving campaigns. In addition, Ameriprise provides gift matching year-round for both employees and eligible advisors.
A dedicated team and values-based culture
Throughout the year, I speak to investors about our firm and the progress we are making. When I speak about Ameriprise as an investment opportunity, I’m speaking about our people and the strength of the Ameriprise team.
We have terrific people who care deeply about our clients, our communities and each other. We’re guided by our values — client-focused, integrity, excellence and respect — and by our long-term perspective. Ameriprise continues to be recognized for the way we do business. We also consistently earn recognition for Ameriprise as a Best Place to Work and as a military-friendly employer.
In closing, I feel very good about Ameriprise. Our diversified business is centered on our clients with complementary capabilities that benefit our clients and generate meaningful shareholder value across market cycles. We have built high-performing businesses and continue to invest to grow.
What we do for clients is unique and sought-after. We can help more individuals, small businesses and institutional investors navigate these uncertain times and maintain appropriate perspective. We have the right strategy and the right team to be successful, and we will continue to focus on executing with excellence and serving our clients’ needs.
It’s important for me to express my gratitude to all the people associated with Ameriprise Financial.
To our clients, thank you for entrusting your goals and assets to Ameriprise. We greatly value your business and will continue to work diligently to deliver value to you and help you achieve your goals.
To our more than 20,000 employees and advisors, thank you for your commitment, energy and enthusiasm. I appreciate all you do for our clients every day.
To my fellow members of the Ameriprise Financial Board of Directors, thank you for your counsel and support. We all benefit from your perspective.
And finally, to our shareholders, thank you for your trust and confidence in Ameriprise. We will continue to do all we can to reward it.
Kind regards,

James M. Cracchiolo
Chairman and Chief Executive Officer
General Information
Executive Offices
Ameriprise Financial Center
707 2nd Avenue South
Minneapolis, MN 55474
612.671.3131
7 World Trade Center
250 Greenwich Street, Suite 3900
New York, NY 10007
Information Available to Shareholders
Copies of our company’s Annual Report on Form 10-K, proxy statement, press releases and other documents, as well as information on financial results and products and services, are available through the Ameriprise Financial website at ameriprise.com. Written copies of these materials are available without charge upon written request to the corporate secretary’s office.
Stock Exchange Listing
New York Stock Exchange
Symbol: AMP
Independent Registered Public Accounting Firm
PricewaterhouseCoopers LLP
45 South 7th Street, Suite #3400
Minneapolis, MN 55402
Transfer Agent
Computershare Trust Company, N.A.
P.O. BOX 505000
Louisville, KY, 40233-5000
866.337.4999
(U.S. and Canada only)
781.575.3223 (International)
Email:
web.queries@computershare.com
Website:
computershare.com/ameriprise
Annual Meeting
The 2018 Annual Meeting of Shareholders of Ameriprise Financial will be held at our Minneapolis headquarters at 707 2nd Avenue South, Minneapolis, MN 55474, on Wednesday, April 25, 2018, at 11 a.m. Central time. A written or audio transcript of the meeting will be available upon written request to the corporate secretary’s office. There will be a modest charge to defray production and mailing costs.
Shareholders
As of Feb. 9, 2018, there were 14,059 shareholders of record. Copies of the Ameriprise Financial Corporate Governance Guidelines, as well as the charters of the four standing committees of the Board of Directors and the Ameriprise Financial Global Code of Conduct, are available on the company’s website at ir.ameriprise.com. Our website also provides important information about how and when we grant share-based compensation such as stock options and restricted stock, including the schedule of grant dates for 2018. We provide a copy of our Long-Term Incentive Awards Policy on our website and explain our policy for the approval of grants on a date when the Compensation and Benefits Committee of the Board of Directors or our chairman and chief executive officer is aware of material, nonpublic information about our company or its securities. Copies of these materials are available without charge upon written request to the corporate secretary’s office.
We filed the Certifications of our chief executive officer and chief financial officer with the Securities and Exchange Commission pursuant to section 302 of the Sarbanes-Oxley Act of 2002 as exhibits 31.1 and 31.2, respectively, to our Annual Report on Form 10-K for the year ended Dec. 31, 2017.
Shareholder and Investor Inquiries
Written shareholder inquiries may be sent to:
Computershare Shareholder Services
P.O. BOX 505000
Louisville, KY, 40233-5000
or to:
Corporate Secretary's Office
1098 Ameriprise Financial Center
Minneapolis, MN 55474
Written inquiries from the investment community should be sent to:
Investor Relations
243 Ameriprise Financial Center
Minneapolis, MN 55474
Trademarks
The following service marks of Ameriprise Financial, Inc. and its affiliates appear in this report:
Ameriprise Financial®
Be Brilliant®
Columbia Threadneedle Investments®
Confident Retirement®
RiverSource®
All other trademarks are property of their respective owners, and their use does not constitute an endorsement of Ameriprise Financial, Inc., its affiliates or subsidiaries, or its or their products or services.
Executive Leadership Team
James M. Cracchiolo
Chairman and Chief Executive Officer
Walter S. Berman
Executive Vice President and Chief Financial Officer
Randy C. Kupper
Executive Vice President and Chief Information Officer
Kelli A. Hunter
Executive Vice President, Human Resources
Karen Wilson Thissen
Executive Vice President and General Counsel
Deirdre D. McGraw
Executive Vice President, Marketing, Corporate
Communications and Community Relations
John R. Woerner
President, Insurance & Annuities and Chief Strategy Officer
Joseph E. Sweeney
President, Advice & Wealth Management
Products and Service Delivery
Neal Maglaque
President, Advice & Wealth Management
Business Development and Chief Operating Officer
William J. (Bill) Williams
Executive Vice President, Ameriprise Franchise Group
Patrick H. O’Connell
Executive Vice President, Ameriprise Advisor Group
William F. (Ted) Truscott
Chief Executive Officer, Global Asset Management
Colin Moore
Executive Vice President, Global Chief Investment Officer
Michelle Scrimgeour
Chief Executive Officer, Europe, Middle East and Africa
Global Asset Management
Scott E. Couto
Executive Vice President, Head of North America
Global Asset Management
Board of Directors
James M. Cracchiolo
Chairman and Chief Executive Officer
Ameriprise Financial, Inc.
Dianne Neal Blixt
Former Executive Vice President and Chief Financial Officer
Reynolds American, Inc.
Amy DiGeso
Former Executive Vice President
Global Human Resources
The Estée Lauder Companies Inc.
Lon R. Greenberg
Chairman Emeritus and Former
Chairman and Chief Executive Officer, UGI Corporation
Siri S. Marshall
Former Senior Vice President
and General Counsel
General Mills, Inc.
Jeffrey Noddle
Former Chairman
SUPERVALU INC.
H. Jay Sarles
Private Investor
Former Vice Chairman
Bank of America
Robert F. Sharpe, Jr.
Former President
Commercial Foods and Chief Administrative Officer
ConAgra Foods, Inc.
Christopher J. Williams
Chief Executive Officer and Founder
The Williams Capital Group, L.P.
Performance Graph
The graph below matches Ameriprise Financial, Inc.’s cumulative five-year total shareholder return on common stock with the cumulative total returns of the S&P 500 Index and the S&P Financials Index. The graph tracks the performance of a $100 investment in our common stock and in each index (with the reinvestment of all dividends) from Dec. 31, 2012 to Dec. 31, 2017.
Comparison of a five-year cumulative total return*
Ameriprise Financial, Inc., the S&P 500 Index and the S&P 500 Financials Index
Ameriprise Financial, Inc.
S&P 500 Index
S&P 500 Financials Index
*$100 invested on Dec. 31, 2011 in stock or index, including reinvestment of dividends.
Fiscal year ending Dec. 31.
The Standard & Poor's 500 Index (S&P 500® Index), an unmanaged index of common stocks, is frequently used as a general measure of market performance. The Index reflects reinvestment of all distributions and changes in market prices, but excludes brokerage commissions or other fees. The S&P 500 Financials Index measures the performance of financial components of the S&P 500 Index.
Past performance does not guarantee future results. It is not possible to invest directly in an index.
Copyright © 2018 Standard & Poor’s, a division of S&P Global. All rights reserved.
This report is not a solicitation for any of the products or services mentioned. Investment products are not FDIC or otherwise federally insured, are not deposits or obligations, or guaranteed by any financial institution, and involve investment risks, including possible loss of principal and fluctuation in value.
Past performance does not guarantee future results. Actual results may vary materially from our plans, estimates and beliefs. Please review carefully the discussion captioned “Forward-Looking Statements” contained in Part II, Item 7 in our Annual Report on Form 10-K for the year ended Dec. 31, 2017.
Past performance does not guarantee future results. Ratings as of Dec. 31, 2017. Columbia funds are available for purchase by U.S. customers. Out of 101 Columbia funds (Institutional share class) rated, 19 received a 5-star Overall Rating and 33 received a 4-star Overall Rating. Out of 92 Threadneedle funds (highest rated share class), 13 received a 5-star Overall Rating and 49 received a 4-star Overall Rating. The Overall Morningstar Rating™ for a fund is derived from a weighted average of the performance figures associated with its 3-, 5- and 10-year Morningstar Rating metrics. Not all funds are available in all jurisdictions. Institutional shares are sold at net asset value and have limited eligibility. Columbia Management Investment Distributors, Inc. offers multiple share classes, not all necessarily available through all firms, and the share class ratings may vary. Contact us for details. On Nov. 1, 2017, Class Z shares were renamed Institutional shares.
For each fund with at least a three-year history, Morningstar calculates a Morningstar Rating™ used to rank the fund against other funds in the same category. It is calculated based on a Morningstar Risk-Adjusted Return measure that accounts for variation in a fund’s monthly excess performance, without any adjustments for loads (front-end, deferred, or redemption fees), placing more emphasis on downward variations and rewarding consistent performance. Exchange-traded funds and open-ended mutual funds are considered a single population for comparative purposes. The top 10% of funds in each category receive 5 stars, the next 22.5% receive 4 stars, the next 35% receive 3 stars, the next 22.5% receive 2 stars and the bottom 10% receive 1 star. (Each share class is counted as a fraction of one fund within this scale and rated separately, which may cause slight variations in the distribution percentages.) The Morningstar Rating™ is for class Z shares only; other classes may have different performance characteristics and may have different ratings.
The following describes the principal subsidiaries that conduct the financial planning, asset accumulation and income, and protection businesses of Ameriprise Financial, Inc. Columbia Mutual Funds are distributed by Columbia Management Investment Distributors, Inc., member FINRA, and managed by Columbia Management Investment Advisers, LLC. Threadneedle International Limited is an FCA- and an SEC-registered investment adviser and an affiliate of Columbia Management Investment Advisers, LLC, based in the U.K. RiverSource insurance and annuity products are issued by RiverSource Life Insurance Company and, in New York, by RiverSource Life Insurance Co. of New York, Albany, NY, and distributed by RiverSource Distributors, Inc. Auto and home insurance is underwritten by IDS Property Casualty Insurance Company, or in certain states, Ameriprise Insurance Company. Personal trust services are offered through Ameriprise National Trust Bank. Ameriprise Financial Services, Inc. Member FINRA and SIPC. Investment advisory services and products are made available through Ameriprise Financial Services, Inc., a registered investment adviser.
The Confident Retirement® approach is not a guarantee of future financial results.
Columbia Threadneedle Investments is the global brand name of the Columbia and Threadneedle group of companies.
Source: Financial planning leader: Ameriprise helped pioneer the financial planning process more than 30 years ago. We have more CERTIFIED FINANCIAL PLANNER™ professionals than any other company in the U.S. as documented by the Certified Financial Planner Board of Standards, Inc., as of Dec. 31, 2017.
Source for rankings information on p. 4: Ratings reflect performance in the investment industry, based on responses to a consumer survey as part of the 2017 Temkin Group Customer Service Ratings, Forgiveness Ratings, Trust Ratings, Loyalty Index, and Net Promoter Score® Benchmark Study. See www.temkinratings.com and temkingroup.com for more.
The Standard & Poor’s 500 Index (S&P 500® Index), an unmanaged index of common stocks, is frequently used as a general measure of market performance. The Index reflects reinvestment of all distributions and changes in market prices, but excludes brokerage commissions or other fees. The S&P 500 Financials Index measures the performance of financial components of the S&P 500 Index.
| ($ in millions) | 2017 | 2016 | 2015 | 2014 | 2013 |
|---|---|---|---|---|---|
| Net income attributable to Ameriprise Financial | $1,480 | $1,314 | $1,562 | $1,619 | $1,334 |
| Less: Income (loss) from discontinued operations, net of tax | (2) | (3) | |||
| Net income from continuing operations attributable to Ameriprise Financial | 1,480 | 1,314 | 1,562 | 1,621 | 1,337 |
| Less: Adjustments(1) | (123) | (113) | (154) | (41) | (123) |
| Operating earnings | 1,603 | 1,427 | 1,716 | 1,662 | 1,460 |
| Less: Tax Act impact | (320) | ||||
| Adjusted operating earnings | 1,923 | 1,427 | 1,716 | 1,662 | 1,460 |
| Less: Annual unlocking effect, net of tax(2) | 64 | (153) | 27 | (28) | 32 |
| Adjusted operating earnings before annual unlocking effect | $1,859 | $1,580 | $1,689 | $1,690 | $1,428 |
| Ameriprise Financial shareholders’ equity(3) | $6,214 | $6,877 | $7,782 | $8,244 | $8,556 |
| Less: Accumulated other comprehensive income (loss), net of tax "AOCI"(3) | 251 | 426 | 516 | 734 | 821 |
| Ameriprise Financial shareholders’ equity from continuing operations excluding AOCI(3) | 5,963 | 6,451 | 7,266 | 7,510 | 7,735 |
| Less: Equity impacts attributable to the consolidated investment entities(3) | 1 | 27 | 216 | 311 | 333 |
| Operating equity(3) | $5,962 | $6,424 | $7,050 | $7,199 | $7,402 |
| Return on equity from continuing operations, excluding AOCI | 24.8% | 20.4% | 21.5% | 21.6% | 17.3% |
| Operating return on equity, excluding AOCI(4) | 26.9% | 22.2% | 24.3% | 23.1% | 19.7% |
| Adjusted operating return on equity excluding AOCI | 32.3% | 22.2% | 24.3% | 23.1% | 19.7% |
| Adjusted operating return on equity excluding AOCI before annual unlocking effect | 31.2% | 24.6% | 24.0% | 23.5% | 19.3% |
(1) Adjustments reflect the trailing twelve months’ sum of after-tax net realized investment gains/losses, net of deferred sales inducement costs (“DSIC”) and deferred acquisition costs (“DAC’) amortization, unearned revenue amortization and the reinsurance accrual; the market impact on variable annuity guaranteed benefits, net of hedges and the related DSIC and DAC amortization; the market impact on indexed universal life benefits, net of hedges and the related DAC amortization, unearned revenue amortization, and the reinsurance accrual; the market impact on fixed index annuity benefits, net of hedges and the related DAC amortization; the market impact of hedges to offset interest rate changes on unrealized gains or losses for certain investments; integration/restructuring charges; and the impact of consolidating certain investment entities. After-tax is calculated using the statutory tax rate of 35%.
(2) After-tax is calculated using the statutory tax rate of 35%.
(3) Amounts represent the five-point average of quarter-end balances.
(4) Operating return on equity excluding accumulated other comprehensive income/loss (AOCI) is calculated using the trailing twelve months of earnings excluding the after-tax net realized investment gains/losses, net of DSIC and DAC amortization, unearned revenue amortization and the reinsurance accrual; market impact on variable annuity guaranteed benefits, net of hedges and related DSIC and DAC amortization; the market impact on indexed universal life benefits, net of hedges and related DAC amortization, unearned revenue amortization, and the reinsurance accrual; the market impact on fixed index annuity benefits, net of hedges and the related DAC amortization; the market impact of hedges to offset interest rate changes on unrealized gains or losses for certain investments; integration/restructuring charges; the impact of consolidating certain investment entities; and discontinued operations in the numerator, and Ameriprise Financial shareholders’ equity excluding AOCI and the impact of consolidating investment entities using a five-point average of quarter-end equity in the denominator. After-tax is calculated using the statutory tax rate of 35%.
| Per Diluted Share | ||||||||||
| ($ in millions, except per share amounts) | 2017 | 2016 | 2015 | 2014 | 2013 | 2017 | 2016 | 2015 | 2014 | 2013 |
|---|---|---|---|---|---|---|---|---|---|---|
| Net income attributable to Ameriprise Financial | $1,480 | $1,314 | $1,562 | $1,619 | $1,334 | $9.44 | $7.81 | $8.48 | $8.30 | $6.44 |
| Less: Income (loss) from discontinued operations, net of tax | - | - | - | (2) | (3) | - | - | - | (0.01) | (0.02) |
| Net income from continuing operations attributable to Ameriprise Financial | 1,480 | 1,314 | 1,562 | 1,621 | 1,337 | 9.44 | 7.81 | 8.48 | 8.31 | 6.46 |
| Less: Net income (loss) attributable to consolidated investment entities | 1 | (2) | - | - | - | - | (0.01) | - | - | - |
| Less: Net realized investment gains(1) | 44 | 6 | 4 | 37 | 7 | 0.28 | 0.03 | 0.02 | 0.19 | 0.03 |
| Add: Integration/restructuring charges(1) | 5 | - | 5 | - | 14 | 0.03 | - | 0.03 | - | 0.06 |
| Add: Market impact on variable annuity guaranteed benefits(1) | 232 | 216 | 214 | 94 | 170 | 1.48 | 1.28 | 1.16 | 0.48 | 0.82 |
| Add: Market impact on indexed universal life benefits(1) | (4) | (36) | 1 | 6 | 13 | (0.02) | (0.21) | 0.01 | 0.03 | 0.06 |
| Add: Market impact of hedges on investments(1) | 2 | (3) | 21 | - | - | 0.01 | (0.02) | 0.11 | - | - |
| Add: Tax effect of adjustments(2) | (67) | (60) | (83) | (22) | (67) | (0.43) | (0.36) | (0.45) | (0.11) | (0.32) |
| Operating earnings | 1,603 | 1,427 | 1,716 | 1,662 | 1,460 | 10.23 | 8.48 | 9.32 | 8.52 | 7.05 |
| Tax Act impact: | ||||||||||
| Less: Tax impact on low income housing assets | (51) | - | - | - | - | (0.32) | - | - | - | - |
| Less: Tax effect of adjustments(3) | (269) | - | - | - | - | (1.72) | - | - | - | - |
| Total Tax Act impact | (320) | - | - | - | - | (2.04) | - | - | - | - |
| Adjusted operating earnings | 1,923 | 1,427 | 1,716 | 1,662 | 1,460 | 12.27 | 8.48 | 9.32 | 8.52 | 7.05 |
| Less: Pretax annual unlocking effect | 99 | (235) | 42 | (43) | 49 | 0.63 | (1.40) | 0.23 | (0.22) | 0.24 |
| Less: Tax effect of annual unlocking effect(2) | (35) | 82 | (15) | 15 | (17) | (0.22) | 0.48 | (0.08) | 0.08 | (0.08) |
| Adjusted operating earnings before annual unlocking effect | $1,859 | $1,580 | $1,689 | $1,690 | $1,428 | $11.86 | $9.40 | $9.17 | $8.66 | $6.89 |
| Weighted average common shares outstanding: | ||||||||||
| Basic | 154.1 | 166.3 | 181.7 | 191.6 | 203.2 | |||||
| Diluted | 156.7 | 168.2 | 184.2 | 195.0 | 207.1 | |||||
| (1) Pretax operating adjustment. | ||||||||||
| (2) Calculated using the statutory tax rate of 35%. | ||||||||||
| (3) Amounts represent the impact of the Tax Act including remeasurement of net deferred tax assets using the lowered corporate tax rate, repatriation tax and the tax effect of low income housing assets. | ||||||||||
| ($ in millions) | 2017 | 2016 | 2015 | 2014 | 2013 |
|---|---|---|---|---|---|
| Total net revenues | $12,027 | $11,696 | $12,170 | $12,268 | $11,199 |
| Less: Revenues attributable to the CIEs | 94 | 128 | 446 | 651 | 345 |
| Less: Net realized investment gains | 46 | 6 | 4 | 37 | 7 |
| Less: Market impact on indexed universal life benefits | 1 | 24 | 7 | (11) | (10) |
| Less: Market impact of hedges on investments | (2) | 3 | (21) | - | - |
| Operating total net revenues | 11,888 | 11,535 | 11,734 | 11,591 | 10,857 |
| Less: Tax impact on low income housing assets | (51) | - | - | - | - |
| Adjusted operating total net revenues | 11,939 | 11,535 | $11,734 | $11,591 | $10,857 |
| Less: Net impact of transitioning advisory accounts to share classes without 12b-1 fees | 60 | 253 | |||
| Adjusted operating total net revenues normalized for 12b-1 impact | $11,879 | $11,282 |
| ($ in millions) | 2017 | 2016 |
|---|---|---|
| Advice & Wealth Management operating net revenues | $5,506 | $5,036 |
| Less: Net impact of transitioning advisory accounts to share classes without 12b-1 fees | 60 | 253 |
| Advice & Wealth Management operating net revenues normalized for 12b-1 impact | $5,446 | $4,783 |