AI just won’t stop eating big tech’s cash
ANTHONY SAGLIMBENE – CHIEF MARKET STRATEGIST, AMERIPRISE FINANCIAL
WEEKLY MARKET PERSPECTIVES — August 3, 2026

U.S. stocks posted a second straight weekly gain, with the S&P 500 Index and NASDAQ Composite both finishing higher. Still, July marked the second consecutive monthly decline for both indices, driven by a sharp unwinding of AI-related momentum, uncertainty around the Federal Reserve, and a notable back-up in long-end Treasury yields. This week, the July employment report and another heavy round of earnings will drive the market’s tone.
Last week in review:
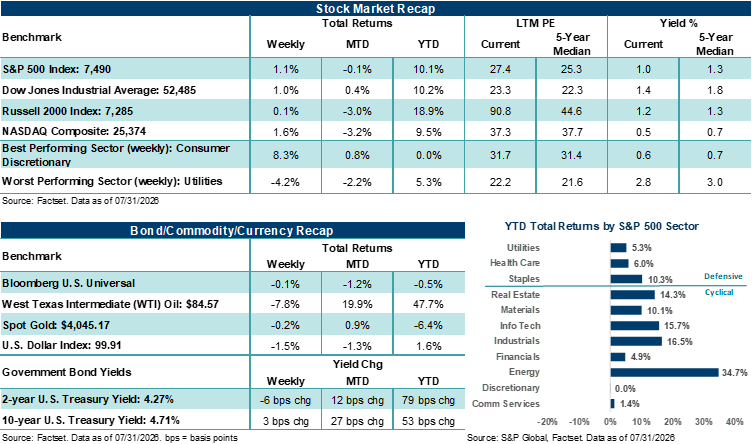
- The S&P 500 Index rose +1.1% last week, the NASDAQ Composite gained +1.6%, the Dow Jones Industrial Average added +1.0%, and the Russell 2000 Index was roughly flat. For the month, the picture was weaker. The S&P 500 fell 0.1%, the NASDAQ dropped 3.2%, and the Russell 2000 declined 3.0%. Notably, the equal-weight S&P 500 outperformed the cap-weighted Index by roughly 120 basis points in July, extending the broadening theme even as it took a breather last week.
- The defining story of July was the unwind in AI-related momentum. The Philadelphia Semiconductor Index fell 20.6% for the month, and memory prices (DRAM) dropped 31.8%, with South Korea emerging as the epicenter of the selling as sharp swings in SK Hynix and Samsung triggered multiple trading halts. In our view, the more important shift was in the narrative itself, moving from the sustainability of AI demand toward the returns on massive capital spending. Even so, hyperscaler earnings largely reinforced the demand story. Microsoft rose +21.8% last week on strong Azure growth, and Amazon gained +17% on accelerating AWS growth and constructive capex return dynamics. Meta Platforms and Apple were the laggards, falling on capex ROI concerns and softer guidance, respectively.
- The July Federal Open Market Committee meeting ended with rates unchanged. However, the long end of the yield curve sold off sharply during Chair Kevin Warsh's press conference, as he again declined to comment on forward guidance. By month-end, markets were pricing in a roughly 65% chance of a September hike.
- Treasury yields moved higher, with the 30-year yield jumping above 5.25% last week, its highest level since 2007. The U.S. Dollar Index fell 1.5% on the week, with yen strength the dominant FX story following intervention. West Texas Intermediate (WTI) crude slipped nearly 8% for the week but gained roughly +20% for the month.
- Geopolitical risk stayed elevated but was largely absorbed by the market. Repeated U.S./Iran strikes and counterstrikes, along with Houthi attacks in the Red Sea, kept oil prices high and renewed concerns around the Strait of Hormuz. In our view, the market's willingness to look through the conflict reflects an assumption that diplomacy ultimately prevails, though the risk of a sustained oil supply shock is not one investors should dismiss. On the economic front last month, initial jobless claims hit their lowest level since 1969, and CPI/PCE inflation readings cooled.
“The AI spending story, the interest-rate story, and the inflation story may be converging in ways that warrant closer monitoring. More bluntly, the market's leaders are spending their cash cushion on an AI bet whose payout remains uncertain, while yields, energy prices, and policy uncertainty complicate the backdrop.”
Anthony Saglimbene - Chief Market Strategist, Ameriprise Financial
AI just won’t stop eating big tech’s cash
July is in the books, and August is upon us. That means more of 2026 is in the rearview mirror than ahead of us. And based on July’s results, the market appears to be stumbling into the last full month of summer. Notably, last week’s key updates stacked one unwelcome development on the next, though stocks finished the week higher. The 30-year Treasury yield hit a 19-year high, oil posted its biggest monthly run since March, conflict in the Middle East continues, U.S. GDP growth came in softer than expected, and the Federal Reserve held rates steady but pleased no one in its messaging. Any one of these developments can make for a difficult environment. Such updates arriving together in a single stretch can be challenging for investors to absorb. And as we’ll discuss below, it’s pretty clear Big Tech is trading in its piles of cash, an attribute that once defined the group, for the allure of AI supremacy.
Start with last week’s Federal Reserve update. Policymakers held the fed funds target range at 3.50% to 3.75% for a fifth straight meeting, splitting 9-3, with Beth Hammack, Lorie Logan, and Neel Kashkari dissenting in favor of a hike. Chair Kevin Warsh framed the hold as a deliberate choice rather than a sign of inertia. But investors’ initial read was that a divided committee and a lack of concrete planning to attack still-elevated inflation may increase the risk of a potential stagflationary environment, even if some of that price pressure is coming from energy. In our view, the Fed’s messaging around rate policy satisfied almost no one, with bonds reacting sharply to Fed takeaways. For example, the 30-year Treasury yield jumped to a 19-year high, and the yield curve steepened as long rates climbed while the front end fell. Higher long-term bond yields are now tightening financial conditions, something Fed Chair Warsh supports and pointed to in his press conference. But this direction carries real consequences for the economy, with the 30-year fixed mortgage rate rising to a one-year high. And the U.S. dollar had its worst week in three months, even as yields rose, which we read as a signal about Fed credibility concerns.
Energy added to the market volatility last week. Oil closed out July with its biggest monthly gain since March, as WTI crude rose near $85 per barrel, driven by supply threats on several fronts. Iran disrupted tanker traffic near the Strait of Hormuz, Red Sea risk expanded (which handles roughly 10% to 12% of global trade), and the U.S. and Iran seem locked in a stalemate, making it difficult to see how the conflict may subside on a more permanent basis.
Here at home, growth cooled more than expected, as second-quarter gross domestic product (GDP) rose just +1.5% against a +2.0% estimate. And the GDP price index ran at +6.2%, while core personal consumption expenditures (PCE) came in at +3.4%. The key takeaway? Economic growth softened more than expected, while prices remained firm in the second quarter, a trend that may continue in the third quarter. Thus, higher yields, higher energy, firmer inflation, and lower growth all landed in a week when the Fed said they weren’t comfortable moving rates, even as they said the market is doing the work for them. So yeah, not a surprise markets might be a little discontent with what they heard on the macro front last week.
Strong Mag Seven results meet increased spending and shrinking cash flow: The bigger story for the market last week came on the earnings front, and from the AI leaders powering major indexes. In total, the prior quarter produced strong results across the six Magnificent Seven reporters, excluding NVIDIA (which reports later this month). However, stock reactions both last week and the prior week have been mixed. In our view, the dividing line between the “haves” and “have-nots” within the group appears to center on free cash flow (FCF) and capital spending dynamics. As we have noted previously, we believe investors have stopped paying for simple earnings beats and raises and are starting to pay for proof that artificial intelligence (AI) spending is converting into cash and revenue.
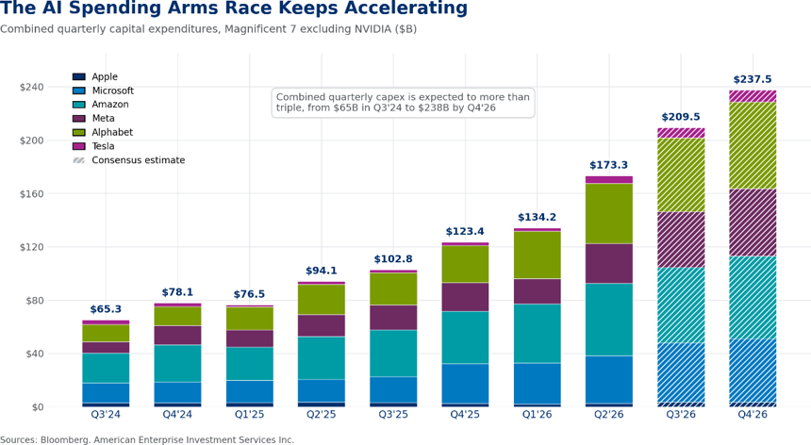
As background, combined quarterly capital expenditures (capex) for the Mag Seven (excluding NVIDIA) are expected to climb to $237.5 billion in Q4’26 from $65.3 billion in Q3’24, more than triple the spending in just a little more than two years. Over a similar window, combined free cash flow is projected to fall 88% for the group, and before Apple's seasonal fourth quarter is projected to lift the group back to about a third of its peak. Simply, spending is compounding at rates that are draining cash flow for some of the largest companies in the Mag Seven.
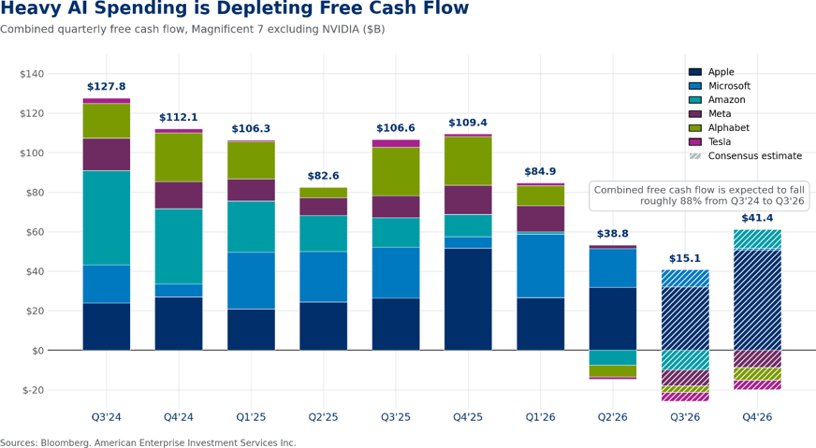
Hence, investors rewarded Microsoft and Amazon last week, and where the spending showed up directly in justified revenue. For example, Microsoft's Azure grew by +43% year-over-year in the prior quarter, and shares rose as much as +16% the day after its report, the biggest single-day gain since March 2020. In addition, Amazon's AWS grew by +37% year-over-year and led the group higher, even with trailing free cash flow of $7.6 billion.
Conversely, investors punished Meta Platforms and Alphabet after their earnings updates and for spending without a matching payoff. Meta's free cash flow has collapsed, while Alphabet posted its first-ever negative free cash flow quarter, with most of its headline profit tied to paper gains on private stakes rather than operations (that said, operating results were still very solid). And Apple fell post-report last week for different reasons, including a guidance miss due to component shortages, even though its $31.9 billion in free cash flow remains the group's fortress.
At the end of the day, increased spending and shrinking cash flow for these companies needs to be justified by rising revenue and the assumption that the revenue bar will be reset higher over the longer term to eventually replenish cash and then some for the effort. If not, why go through all this trouble? That’s where the narrative stands today. That’s why the Mag Seven collectively hasn’t done anything all year. That’s why the group is trading less homogeneously. And this dynamic may not change for the foreseeable future, based on the latest profit updates.
The market’s discontent, in a nutshell: Combine the macro environment and Mag Seven earnings updates, and the source of market volatility seems pretty clear to us. Higher yields raise the bar for every long-duration asset. Falling free cash flow and rising capex weigh directly on the megacaps that lead the S&P 500 and NASDAQ Composite. And weaker guidance in pockets like Apple adds pressure on even the most disciplined spenders.
Not mentioned yet, but important to note, is that some of the largest tech companies have shifted from self-funding their ambitions to relying more on debt and equity markets to finance the AI buildout. Big Tech debt has more than doubled to roughly $455 billion, and hyperscaler bond spreads now run 61% wider than the broad investment-grade index, according to Bloomberg. Credit investors have been quicker to price this cash flow and spending issue than equity investors, in our view. As the Federal Reserve is beginning to note, the AI spending story, the interest-rate story, and the inflation story may be converging in ways that warrant closer monitoring. More bluntly, the market's leaders are spending their cash cushion on an AI bet whose payout remains uncertain, while yields, energy prices, and policy uncertainty complicate the backdrop.
Bottom line: In our view, the market’s discontent last month was warranted, as evidenced by weaker stock performance and increased AI scrutiny. But the fundamental foundation under this market and economy is stronger than the headlines suggest. The economy is still growing, and some of the companies closest to the consumer, such as Visa, point to broad-based spending strength and a healthy base case for the second half.
Also, S&P 500 profits have been extraordinary this year. With more than 60% of Index results in the bag, Q2’26 blended earnings per share (EPS) growth is approaching +50% year-over-year, on revenue growth of +14%. Notably, the Q3 and Q4 outlooks point to solid profit growth in the quarters ahead, including in non-Tech areas.
Just as important, a good portion of the repositioning and volatility seen in the market last month may be winding down. Leverage is coming down across institutional investors. We believe the momentum unwind is getting long in the tooth. And the AI spending concerns are being aired and priced in the open market rather than festering behind the scenes. Overall, we believe a growing economy, a resilient consumer, and a profit engine still running at full throttle support a “staying invested approach”. Consider favoring the profitable AI leaders (be selective, or choose strategies that do this for you) and lean heavily into a well-diversified approach in case the summer of our discontent continues.
The week ahead:
- The July employment report on Friday headlines a busy data week, with consensus estimates looking for +75,000 nonfarm payrolls and the unemployment rate holding at 4.2%. ISM Manufacturing (Monday) and ISM Services (Wednesday) round out the key macro releases.
- Q2 earnings remain very constructive for the market, in our view. With just over 60% of the S&P 500 reported, 86% of companies beat consensus estimates, and aggregate earnings have come in an eyepopping +31% above expectations.
- Peak earnings season continues, with reports from Caterpillar, McDonald's, AMD, and Uber representing another large slice of S&P 500 market capitalization.
These figures are shown for illustrative purposes only and are not guaranteed. They do not reflect taxes or investment/product fees or expenses, which would reduce the figures shown here. An index is a statistical composite that is not managed. It is not possible to invest directly in an index. Past performance is not a guarantee of future results.
Sources: FactSet and Bloomberg. FactSet and Bloomberg are independent investment research companies that compile and provide financial data and analytics to firms and investment professionals such as Ameriprise Financial and its analysts. They are not affiliated with Ameriprise Financial, Inc.
The views expressed are as of the date given, may change as market or other conditions change, and may differ from views expressed by other Ameriprise Financial associates or affiliates. Actual investments or investment decisions made by Ameriprise Financial and its affiliates, whether for its own account or on behalf of clients, will not necessarily reflect the views expressed. This information is not intended to provide investment advice and does not account for individual investor circumstances.
Some of the opinions, conclusions and forward-looking statements are based on an analysis of information compiled from third-party sources. This information has been obtained from sources believed to be reliable, but accuracy and completeness cannot be guaranteed by Ameriprise Financial. It is given for informational purposes only and is not a solicitation to buy or sell the securities mentioned. The information is not intended to be used as the sole basis for investment decisions, nor should it be construed as advice designed to meet the specific needs of an individual investor.
Alternative investments cover a broad range of strategies and structures designed to be low or non-correlated to traditional equity and fixed-income markets with a long-term expectation of illiquidity. Alternative investments involve substantial risks and may be more volatile than traditional investments, making them more appropriate for investors with an above-average tolerance for risk.
Portfolios that hold a limited number of securities or concentrate investments in similar industries, sectors or geographical regions may experience greater volatility and greater risk of loss as the performance of these investments (either positive or negative) will have a greater impact on the portfolio as a whole.
International investing involves certain risks and volatility due to potential political, economic, social, or currency instabilities and different financial and accounting standards. These risks are enhanced for emerging markets.
Diversification does not assure a profit or protect against loss.
Commodity investments may be affected by the overall market and industry- and commodity-specific factors, and may be more volatile and less liquid than other investments.
There are risks associated with fixed-income investments, including credit (issuer default) risk, interest rate risk, and prepayment and extension risk. In general, bond prices rise when interest rates fall and vice versa. This effect is usually more pronounced for longer term securities.
Stock investments involve risk, including loss of principal. High-quality stocks may be appropriate for some investment strategies. Ensure that your investment objectives, time horizon and risk tolerance are aligned with investing in stocks, as they can lose value.
Investments in small cap companies involve risks and volatility greater than investments in larger, more established companies.
Generally, large-cap companies are more mature and have limited growth potential compared to smaller companies. In addition, large companies may not be able to adapt as easily to changing market conditions, potentially resulting in lower overall performance compared to the broader securities markets during different market cycles
The products of technology companies may be subject to severe competition and rapid obsolescence, and their stocks may be subject to greater price fluctuations.
Past performance is not a guarantee of future results.
An index is a statistical composite that is not managed. It is not possible to invest directly in an index.
Definitions of individual indices and sectors mentioned in this article are available on our website at ameriprise.com/legal/disclosures in the Additional Ameriprise research disclosures section.
The S&P 500 Index is a basket of 500 stocks that are considered to be widely held. The S&P 500 index is weighted by market value (shares outstanding times share price), and its performance is thought to be representative of the stock market as a whole. The S&P 500 index was created in 1957 although it has been extrapolated backwards to several decades earlier for performance comparison purposes. This index provides a broad snapshot of the overall US equity market. Over 70% of all US equity value is tracked by the S&P 500. Inclusion in the index is determined by Standard & Poor’s and is based upon their market size, liquidity, and sector.
The NASDAQ Composite index measures all NASDAQ domestic and international based common type stocks listed on the Nasdaq Stock Market.
The Dow Jones Industrial Average (DJIA) is an index containing stocks of 30 Large-Cap corporations in the United States. The index is owned and maintained by Dow Jones & Company.
The Russell 2000 Index measures the performance of the small-cap segment of the US equity universe. The Russell 2000 is constructed to provide a comprehensive and unbiased small-cap barometer and is completely reconstituted annually to ensure larger stocks do not distort the performance and characteristics of the true small-cap opportunity set. The Russell 2000 includes the largest 2000 securities in the Russell 3000.
The US Dollar Index (USDX) indicates the general international value of the USD. The USDX does this by averaging the exchange rates between the USD and major world currencies. This is computed by using rates supplied by approximately 500 banks.
West Texas Intermediate (WTI) is a grade of crude oil commonly used as a benchmark for oil prices. WTI is a light grade with low density and sulfur content.
The Philadelphia Semiconductor Index (SOX) is a stock market index that tracks the performance of companies in the semiconductor (chip) industry.
A capitalization-weighted index assigns each company a weight based on its total market value (market capitalization). Companies with larger market capitalizations have a greater influence on the index's performance than smaller companies.
An equal-weighted index assigns the same weight to every company in the index, regardless of its market capitalization.
Third party companies mentioned are not affiliated with Ameriprise Financial, Inc.
Investment products are not insured by the FDIC, NCUA or any federal agency, are not deposits or obligations of, or guaranteed by any financial institution, and involve investment risks including possible loss of principal and fluctuation in value.
Securities offered by Ameriprise Financial Services, LLC. Member FINRA and SIPC.
© 2026 Ameriprise Financial, Inc. All rights reserved.