AI’s math problem deepens ahead of key hyperscaler reports
ANTHONY SAGLIMBENE – CHIEF MARKET STRATEGIST, AMERIPRISE FINANCIAL
WEEKLY MARKET PERSPECTIVES — October 19, 2026

U.S. stocks were mostly lower last week, with the NASDAQ Composite posting its worst week since June as a broad selloff in AI-related stocks spread into the debt markets. This week, the first peak week of third-quarter earnings begins, with Meta Platforms and Tesla leading a heavy slate of reports.
Last week in review:
- The S&P 500 Index fell 1.9% last week, the NASDAQ Composite dropped 4.5%, and the Russell 2000 Index declined 3.0%. The Dow Jones Industrial Average rose +0.7%. The equal-weight S&P 500 outperformed the cap-weighted Index by 225 basis points, its widest margin since November 2020. Consumer Staples, Energy, and Healthcare led, while Technology lagged.
- Pressure on AI stocks deepened. The Philadelphia Semiconductor Index fell 11.4% for the week and declined for eight straight sessions, tied for its longest losing streak since 2006. Memory stocks and neocloud providers fell even more sharply. The selling also extended to AI debt financing, with CoreWeave’s bonds experiencing severe pressure. Taiwan Semiconductor and ASML both raised guidance, but their stocks still declined, while reports indicated investors were discussing a lower valuation for Anthropic's upcoming IPO.
- Treasury yields were volatile. Investors moved into Treasuries as stocks fell, with prices posting their best week since February despite two hotter-than-expected inflation reports. The 2-year yield fell 7 basis points, while the 10-year yield ended down 16 basis points. The U.S. Dollar Index fell 0.4%, Gold declined 0.7%, and West Texas Intermediate (WTI) crude rose +2.7%, settling above $100 per barrel.
- Inflation data came in hotter than expected. September core CPI rose +0.3% month over month, above the +0.2% consensus. Core PPI also beat expectations, which led several economists to raise their September core PCE forecasts. September industrial production also came in above consensus.
- Big bank earnings were mixed. Several banks raised their net interest income outlooks, and Morgan Stanley reported strong equities trading. However, softer fixed-income trading, higher expenses, and caution regarding near-term capital markets activity weighed on results. Bank of America also took a $1.2 billion regulatory charge.
“In our view, the Q3 earnings season should help investors better assess whether growing revenue and backlogs are translating into cash to help support the AI expansion, or whether ever-growing financing and debt are needed to support the buildout.”
Anthony Saglimbene - Chief Market Strategist, Ameriprise Financial
AI’s math problem deepens ahead of key hyperscaler reports
Pockets of the AI trade came under severe selling pressure last week as investors reassess financing costs, competition, and the returns on infrastructure spending. For example, semiconductor and memory stocks saw weakness, while companies building and operating AI computing capacity faced greater scrutiny over their borrowing needs. During the week, selling extended into software, networking, and technology hardware, putting pressure on the broader market ahead of key tech earnings reports this week and next.
Notably, several concerns are hitting investors at once. Advances in Chinese memory technology are challenging assumptions about the competitive advantages of established suppliers. Industry executives are questioning whether capital will remain readily available to fund expansion. And the yield on CoreWeave’s debt soared last week as its bonds traded at distressed levels. Simply, investors are becoming less willing to finance growth in the current environment without a clearer path to stronger returns.
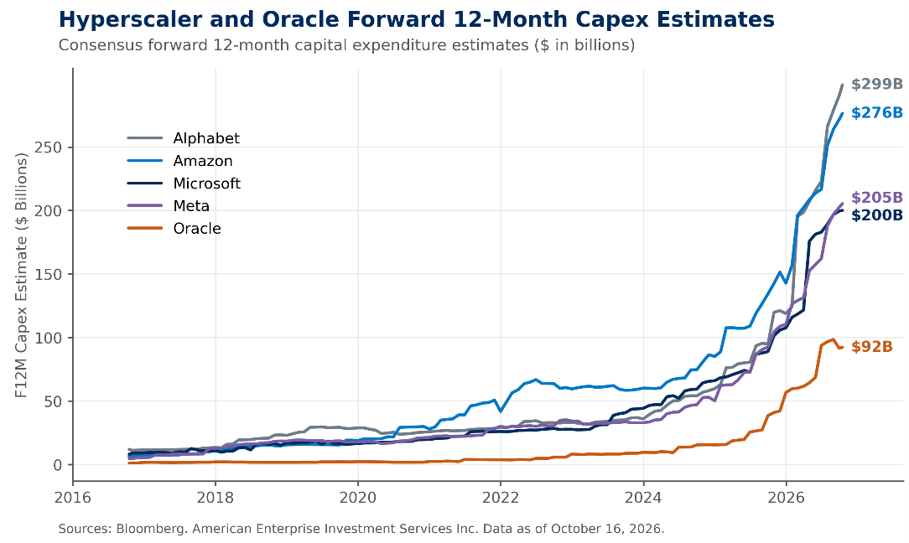
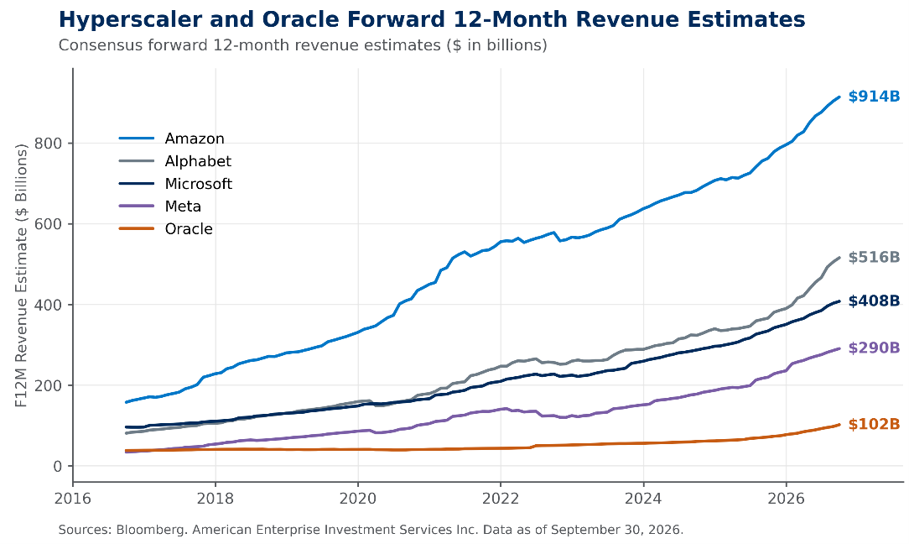
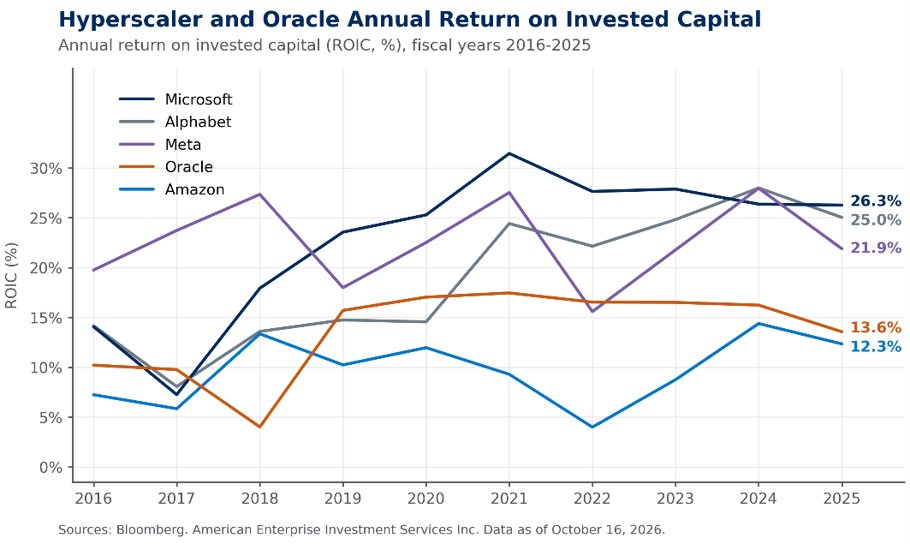
This graph is shown for illustrative purposes only.
Of course, the current interest rate backdrop is adding a complicating factor to an already complex structure of AI debt and financing agreements. And the hotter-than-expected September inflation reports last week have increased volatility around Federal Reserve tightening odds through year-end. Further, Treasury bond yields saw increased volatility last week as investors moved back and forth between seeking safety amid AI volatility and discounting future inflation and growth dynamics.
As we discussed in September, the AI math problem (i.e., aggressive spending versus unknown future profits) is also receiving more scrutiny on how money moves through the ecosystem. For example, chipmakers can invest across the AI complex, which then uses that capital to buy their processors. Thus, the same company can act as investor, supplier, and leaseholder on a data center, allowing capital committed at one stage to return as revenue at another. These arrangements can accelerate construction, but they also make it harder to distinguish independent customer demand from spending supported by suppliers’ financing. In our view, the Q3 earnings season should help investors better assess whether growing revenue and backlogs are translating into cash to help support the AI expansion, or whether ever-growing financing and debt are needed to support the buildout.
That said, real addressable demand continues to support the AI expansion. For example, Taiwan Semiconductor Manufacturing’s latest quarterly revenue exceeded its preliminary guidance, and management raised its full-year revenue growth outlook while maintaining capital spending plans. The company continues to describe AI demand as “exceeding available capacity”. However, its caution about planning for 2027 centered mainly on macroeconomic uncertainty and consumer-sensitive markets, rather than an identified slowdown in AI demand. Given the company makes most of the world’s advanced chips, its updated pulse check on the AI theme is important to note.
In addition, Anthropic reportedly told prospective investors that Q3 revenue reached $16.8 billion and that the company was profitable on an adjusted basis with positive cash flow. In our view, the update supports the case for adopting paid AI, but it still leaves open questions about development costs, infrastructure payments, and future compute commitments.
Yet, strong demand in “pockets” of AI doesn’t mean every company funding the buildout will earn attractive returns over time. According to FactSet, semiconductor and equipment earnings are expected to grow roughly +130% year-over-year in Q3, compared with just +14% for software. Simply, equipment spending generates revenue for the supplier today before the buyer necessarily earns an attractive return using it. We believe strong semiconductor results can therefore coexist with increasing scrutiny on the companies financing and operating the AI infrastructure buildout. That’s why we believe the upcoming earnings reports and outlooks from the hyperscalers this week and next week could help investors further evaluate the customer side of that equation.
For example, Meta Platforms reports results on Wednesday, followed by Microsoft, Alphabet, and Amazon next week. We believe investors will focus on whether hyperscaler monetization is keeping pace with spending and on how management intends to finance the next stage of expansion. For Microsoft and Amazon, we believe cloud growth should be assessed alongside the cash required to deliver additional capacity. Corporate guidance should explain whether spending addresses demand already committed by customers or builds ahead of anticipated needs. Faster revenue growth would carry greater weight if accompanied by a credible path to improving cash generation, which has been declining in recent quarters.
For Meta Platforms and Alphabet, we believe the discussion should also connect AI investment to advertising performance, engagement, and operating efficiency. According to FactSet, Interactive Media & Services earnings are expected to rise +44% year-over-year in Q3 on revenue growth of +24%. Of course, those estimates encompass the industry’s overall operations rather than AI alone. Yet, we believe management commentary should help investors assess how much AI contributes to those improvements and whether the benefits justify additional investment.
We believe larger backlogs will require more explanation on earnings calls. Multi-year commitments can support future revenue expectations but also require substantial AI spending before additional cash flows arrive. As these companies report, analysts and investors will want more details on delivery schedules, customer payments, and the funding required to fulfill those contracts. Power availability and construction timelines will also come into focus on hyperscaler calls.
In addition, financing capacity could increasingly separate companies across the ecosystem as AI scrutiny grows. In our view, businesses funding expansion from existing operations (which admittedly is increasingly difficult today given the size of spending) should have greater flexibility in a rising-rate environment than those dependent on repeated borrowing or equity issuance. Additionally, wider credit spreads for some AI borrowers (see CoreWeave and Oracle as examples) are already creating differentiation across the ecosystem.
Importantly, we expect analysts to ask the hyperscalers more pointed questions about spending discipline on earnings calls. Given the five major hyperscalers (Microsoft, Alphabet, Amazon, Meta Platforms, and Oracle) are forecast to spend over $1 trillion in capex combined over the next 12 months, we doubt management teams will get a free pass this earnings season from explaining why they can’t slow their spending down in order to better protect their balance sheets. Of course, commentary and color here will likely be consequential for earnings expectations across the AI supply chain, particularly for semiconductors and hardware manufacturers. Any reassessment in hyperscaler spending could also reach beyond technology into industrials, power infrastructure, and the lenders financing the AI buildout.
Bottom line: Last week's AI volatility and the upcoming hyperscaler reports lead back to the same AI math problem. Over the past year, consensus capex estimates for the largest AI spenders have more than doubled. Their revenue estimates have grown by roughly a quarter. In our view, that gap can't stay this wide indefinitely. Either revenue catches up more quickly, or spending plans get reset.
So far, returns have held up. Most of these companies still earn strong returns on their invested capital, which is why investors have been willing to fund the buildout (granted, much of those returns came from money spent before the current wave).
The test now is whether those returns hold (and probably need to rise) as spending continues to climb. Notably, corporate guidance that ties AI spending to visible revenue and delivers steady returns on capital should be rewarded. Spending plans that keep rising without that link will likely meet a tougher reception from investors. We believe AI remains a long-term driver of earnings and economic growth, but investors are becoming more selective about which companies get rewarded from here. For investors, that argues for owning AI exposure selectively rather than broadly, keeping technology concentration in check, and diversifying across market caps, sectors, and regions. Expect volatility around these reports, but we would advise not letting it derail longer-term allocation decisions.
The week ahead:
- Third-quarter earnings ramp up with GE Aerospace, General Motors, RTX, Netflix, and SpaceX on Tuesday. Meta Platforms, Tesla, IBM, and Lam Research report Wednesday, followed by Honeywell, Lockheed Martin, and Union Pacific on Thursday.
- Economic data includes September housing starts and pending home sales on Tuesday, plus flash October PMIs and final October University of Michigan consumer sentiment on Friday.
- The Federal Reserve is now in its quiet period ahead of the October 28th FOMC meeting. Markets have reduced the odds of an October rate hike to roughly 16% but still see a December hike as very likely.
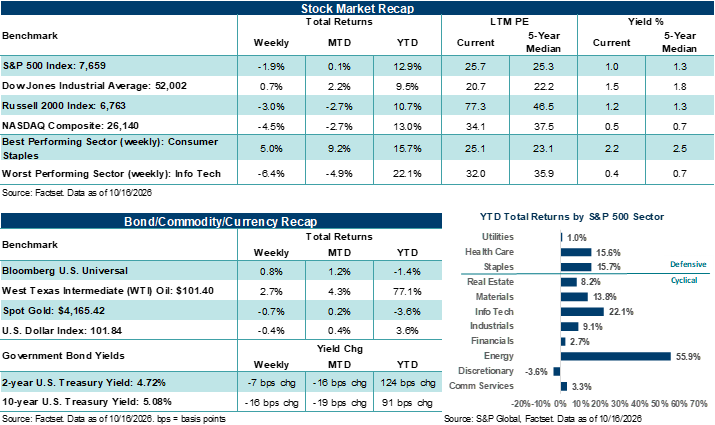
These figures are shown for illustrative purposes only and are not guaranteed. They do not reflect taxes or investment/product fees or expenses, which would reduce the figures shown here. An index is a statistical composite that is not managed. It is not possible to invest directly in an index. Past performance is not a guarantee of future results.
Important Disclosures
Sources: FactSet and Bloomberg. FactSet and Bloomberg are independent investment research companies that compile and provide financial data and analytics to firms and investment professionals such as Ameriprise Financial and its analysts. They are not affiliated with Ameriprise Financial, Inc.
The views expressed are as of the date given, may change as market or other conditions change, and may differ from views expressed by other Ameriprise Financial associates or affiliates. Actual investments or investment decisions made by Ameriprise Financial and its affiliates, whether for its own account or on behalf of clients, will not necessarily reflect the views expressed. This information is not intended to provide investment advice and does not account for individual investor circumstances.
Some of the opinions, conclusions and forward-looking statements are based on an analysis of information compiled from third-party sources. This information has been obtained from sources believed to be reliable, but accuracy and completeness cannot be guaranteed by Ameriprise Financial. It is given for informational purposes only and is not a solicitation to buy or sell the securities mentioned. The information is not intended to be used as the sole basis for investment decisions, nor should it be construed as advice designed to meet the specific needs of an individual investor.
Alternative investments cover a broad range of strategies and structures designed to be low or non-correlated to traditional equity and fixed-income markets with a long-term expectation of illiquidity. Alternative investments involve substantial risks and may be more volatile than traditional investments, making them more appropriate for investors with an above-average tolerance for risk.
Portfolios that hold a limited number of securities or concentrate investments in similar industries, sectors or geographical regions may experience greater volatility and greater risk of loss as the performance of these investments (either positive or negative) will have a greater impact on the portfolio as a whole.
International investing involves certain risks and volatility due to potential political, economic, social, or currency instabilities and different financial and accounting standards. These risks are enhanced for emerging markets.
Diversification does not assure a profit or protect against loss.
Commodity investments may be affected by the overall market and industry- and commodity-specific factors, and may be more volatile and less liquid than other investments.
There are risks associated with fixed-income investments, including credit (issuer default) risk, interest rate risk, and prepayment and extension risk. In general, bond prices rise when interest rates fall and vice versa. This effect is usually more pronounced for longer term securities.
Stock investments involve risk, including loss of principal. High-quality stocks may be appropriate for some investment strategies. Ensure that your investment objectives, time horizon and risk tolerance are aligned with investing in stocks, as they can lose value.
Investments in small cap companies involve risks and volatility greater than investments in larger, more established companies.
Generally, large-cap companies are more mature and have limited growth potential compared to smaller companies. In addition, large companies may not be able to adapt as easily to changing market conditions, potentially resulting in lower overall performance compared to the broader securities markets during different market cycles
The products of technology companies may be subject to severe competition and rapid obsolescence, and their stocks may be subject to greater price fluctuations.
Past performance is not a guarantee of future results.
An index is a statistical composite that is not managed. It is not possible to invest directly in an index.
Definitions of individual indices and sectors mentioned in this article are available on our website at ameriprise.com/legal/disclosures in the Additional Ameriprise research disclosures section.
The S&P 500 Index is a basket of 500 stocks that are considered to be widely held. The S&P 500 index is weighted by market value (shares outstanding times share price), and its performance is thought to be representative of the stock market as a whole. The S&P 500 index was created in 1957 although it has been extrapolated backwards to several decades earlier for performance comparison purposes. This index provides a broad snapshot of the overall US equity market. Over 70% of all US equity value is tracked by the S&P 500. Inclusion in the index is determined by Standard & Poor’s and is based upon their market size, liquidity, and sector.
The NASDAQ Composite index measures all NASDAQ domestic and international based common type stocks listed on the Nasdaq Stock Market.
The Dow Jones Industrial Average (DJIA) is an index containing stocks of 30 Large-Cap corporations in the United States. The index is owned and maintained by Dow Jones & Company.
The Russell 2000 Index measures the performance of the small-cap segment of the US equity universe. The Russell 2000 is constructed to provide a comprehensive and unbiased small-cap barometer and is completely reconstituted annually to ensure larger stocks do not distort the performance and characteristics of the true small-cap opportunity set. The Russell 2000 includes the largest 2000 securities in the Russell 3000.
The US Dollar Index (USDX) indicates the general international value of the USD. The USDX does this by averaging the exchange rates between the USD and major world currencies. This is computed by using rates supplied by approximately 500 banks.
West Texas Intermediate (WTI) is a grade of crude oil commonly used as a benchmark for oil prices. WTI is a light grade with low density and sulfur content.
The Philadelphia Semiconductor Index (SOX) is a stock market index that tracks the performance of companies in the semiconductor (chip) industry.
Core PCE is a measure of inflation that tracks changes in the prices of goods and services purchased by consumers excluding food and energy prices.
Core CPI measures changes in the prices consumers pay for goods and services, excluding food and energy, to provide a clearer view of persistent inflation.
Core PPI (Core Producer Price Index) measures the average change over time in the prices received by producers for their goods and services, excluding food and energy prices.
Third party companies mentioned are not affiliated with Ameriprise Financial, Inc.
Investment products are not insured by the FDIC, NCUA or any federal agency, are not deposits or obligations of, or guaranteed by any financial institution, and involve investment risks including possible loss of principal and fluctuation in value.
Securities offered by Ameriprise Financial Services, LLC. Member FINRA and SIPC.
© 2026 Ameriprise Financial, Inc. All rights reserved.