Can the next Congress really address Americans’ kitchen-table concerns?
ANTHONY SAGLIMBENE – CHIEF MARKET STRATEGIST, AMERIPRISE FINANCIAL
WEEKLY MARKET PERSPECTIVES — November 2, 2026

U.S. stocks were mostly lower last week as AI-related stocks came under renewed pressure, while small-caps and the equal-weight S&P 500 moved higher. The S&P 500 Index posted its second straight monthly decline in October, and the NASDAQ Composite had its worst month since March 2025. This week, the October employment report, ISM data, and the U.S. midterm elections will be in focus.
Last week in review:
- The S&P 500 Index fell 0.6% last week, the NASDAQ Composite dropped 2.0%, and the Dow Jones Industrial Average declined 0.9%. The Russell 2000 Index rose +1.3%. In October, the S&P 500 fell 0.9%, the NASDAQ dropped 5.3%, and the Dow gained +1.7%. The equal-weight S&P 500 rose nearly +5.0% for the month and outperformed the cap-weighted Index by 590 basis points. Energy, Consumer Staples, and Utilities led sector performance in October, while Communication Services and Technology lagged.
- Treasury yields moved lower, with the 10-year yield ending the week at 4.91%, down 36 basis points for the month. The U.S. Dollar Index was roughly flat for the week and up +0.4% for October. Gold fell last week, settling below $4,000 per ounce for the first time since mid-July, and ended October down almost 7.0%. West Texas Intermediate (WTI) crude settled above $100 per barrel on U.S./Iran escalation risk.
- AI stocks remained under pressure. In October, the investor debate moved from AI demand to how companies will pay for the buildout. The Philadelphia Semiconductor Index fell 15.4% for the month, and memory stocks dropped more than 20%. Last week, hyperscaler results pointed to strong underlying demand, with sharply higher cloud backlogs at Microsoft, Alphabet, and Amazon. However, investors focused on less flattering parts of the reports. Alphabet fell 12.6% on softer Search results, and Amazon's AWS growth fell short of elevated investor expectations. Microsoft also issued investment-grade debt for the first time since 2017, adding to concerns about how the AI buildout will be funded. Separately, Intel dropped 24.4% for the week. Strength in its Data Center and AI business was outweighed by weaker fourth-quarter guidance, an expected 10% decline in the PC market next year, and higher capital spending that management said will turn free cash flow negative.
- The Federal Reserve held rates steady last week, with two officials dissenting in favor of a rate hike. Fed Chair Kevin Warsh said financial conditions have tightened but are not yet tight, and he reaffirmed the Fed's commitment to bringing inflation back to target. Markets are pricing in roughly a 70% chance of a December rate hike.
- Economic data was solid. The first estimate of third-quarter GDP showed +3.4% annualized growth, above consensus. September core PCE inflation was in line with expectations. Durable goods orders and October consumer confidence beat forecasts, and jobless claims stayed near multi-decade lows. Third-quarter earnings also remain strong, with blended S&P 500 earnings growth of roughly +30% year-over-year and 82% of companies beating estimates.
“In part, Tuesday's results will likely decide who leads Washington's cost-of-living debate heading into the 2028 campaign. Yet the forces that drive stocks over time, including economic growth, corporate profits, and interest rates, will likely be shaped by dynamics outside Washington next year.”
Anthony Saglimbene - Chief Market Strategist, Ameriprise Financial
Can the next Congress really address Americans’ kitchen-table concerns?
After what has seemed like an endless midterm election cycle in recent months, voters finally head to the polls on Tuesday a) to pick their next leaders, but b) to finally wrestle back from politicians and donors their familiar pharmaceutical, car, beer, and gambling television ads. According to Bloomberg and AdImpact, the 2026 mid-term elections are on track to be the most expensive in U.S. history, with candidates, parties, and outside groups collectively spending at a record pace across television, digital, and online platforms. All that ad spending, along with voters’ cost-of-living concerns this election cycle, has led to more than 53 million early ballots being cast as of November 1, according to the University of Florida Election Lab, a pace that has already surpassed the 2022 midterm of roughly 46 million early ballots.
While investors have benefited from the S&P 500 Index being up roughly +11% this year (on pace for the fourth year of double-digit annual returns), household budgets are being squeezed by oil above $100 per barrel and a 10-year Treasury yield near 5.0%. Simply, rising costs for consumers and businesses, which have been front and center for voters this election cycle, are unlikely to fade, in our view, no matter how the midterm results play out this week.
Most Americans want to see the cost of their essentials go down or at least stop rising faster than their paychecks. That starts with the bills households can't avoid. Gasoline, diesel, and heating costs have remained elevated since the U.S./Iran conflict pushed oil higher in late February. Grocery bills have followed, since higher fuel costs travel with every truckload of food. Notably, housing has become harder to afford as mortgage rates have climbed. And healthcare, insurance, and electricity remain persistent pressure points, with data-center demand adding a new worry about utility rates in some communities.
Importantly, we believe price increases have compounded over several years, sapping consumer sentiment and adding to voter frustration. For example, consumer prices are still running +3.7% above a year ago, on top of several years of elevated inflation, and those higher prices don't reverse when inflation cools. Most of the purchases outlined above are also necessities, including home or rent. Though a family can delay buying a new car, they can’t avoid paying their electric bill or buying groceries. Importantly, higher interest rates have also raised the cost of carrying a mortgage, a car loan, or a credit card balance. In our view, that combination explains why many voters feel stretched today, even with unemployment low, and especially if they haven’t benefited from rising asset values in stocks and homes.
So, can Washington really address what voters are most concerned about at the moment? That is, higher prices. Our advice: Don’t hold your breath. Under divided government (the most likely outcome), we likely expect lawmakers to spend much of 2027 negotiating government funding and the debt limit, leaving little room for broad relief on voters' top concerns. For investors, the more important signals will come from those agreements and from how the White House responds as passing legislation gets more difficult in divided government.
Start with housing. The average 30-year fixed mortgage rate sits at 7.28% today, up from roughly 6.3% a year ago. On a $400,000 loan with 20% down, that adds roughly $200 to the monthly payment before property taxes, insurance, and maintenance (which, by the way, have also increased over the years). Lasting relief requires lower financing costs and more homes for sale. It’s unlikely Congress can deliver on these fronts directly or quickly.
Of course, higher energy prices are a main source of voter strain this year. Oil above $100 per barrel raises what households pay at the pump and what businesses pay to make and move goods across the country. Oxford Economics expects high diesel prices could further feed into food and other prices more materially in 2027 if oil prices remain elevated. And as most investors understand, the path forward for the U.S./Iran conflict will likely matter more for oil prices than any change in congressional control.
Bottom line: Voters want lower costs, but the biggest drivers, including energy, food, mortgage rates, oil prices, and housing supply, sit largely outside Congress's immediate reach. Thus, we believe the thrust of voters’ cost-of-living concerns, which may drive a divided government over the next two years, is unlikely to be resolved by a change in Congressional leadership alone.
And on the monetary front, don't expect the Federal Reserve to step in quickly, either. Last week, policymakers held rates steady at 3.75%–4.00%, as expected. The Fed described economic growth as “strong” and inflation as “elevated”. In our view, there's little reason to expect lower borrowing costs in the near-to-intermediate-term, given current economic fundamentals.
We believe these dynamics matter for stock prices as well. The S&P 500 trades at roughly 18.5x the profits companies are expected to earn over the next year, a price that already assumes healthy growth ahead. Meanwhile, a risk-free 10-year Treasury bond pays close to 5.0% a year. When a government-backed investment pays that much, investors have less patience for companies that miss expectations (see last week’s Mag Seven reactions as an example). Further, consumer-facing stocks have already seen pockets of pressure this year due to the cost-of-living dynamics noted above and changes in spending behavior. In our view, companies will need to deliver the profit growth already built into their share prices next year, a requirement that also lies outside the control of the next Congress.
Turning to the election itself, we believe a result this week that leads to Democrats taking control of the House while Republicans maintain control of the Senate would likely prompt a limited initial market reaction, as this outcome is largely priced into current expectations. This result could lead to an increase in investigations, funding debates, and little, if any, new legislation. Oxford Economics assumes Congress will handle funding and the debt limit without new economic support, aside from possibly extending temporary tax provisions set to expire after 2028. As such, that leaves little reason to expect a broad household-relief package in 2027 that addresses voters’ main cost-of-living concerns. And under this Washington makeup, the White House's response and congressional leaders' first priorities could give investors a good sense of what the next two years may look like.
Importantly, the test for investors is whether lawmakers meet their budget deadlines over the next two years without a prolonged shutdown or debt-limit scare. Narrow majorities in the House and Senate make this test harder, and history is littered with recent instances in which lawmakers have found it very difficult to meet this simple expectation. And with Congress divided, the White House could lean more heavily on tariffs, export controls, agency actions, and international issues that don't require new legislation, keeping policy risk elevated for businesses over the next two years.
On the other hand, a Democratic sweep of both the House and Senate (which prediction odds suggest is a possibility) would give Congress more leverage over the White House and more room for coordinated investigations and pressure tactics (e.g., end the conflict with Iran and ease sanctions and tariffs on key trading partners). Further, a Senate majority would allow Democrats to slow or block White House nominees, making it harder for President Trump to install preferred officials at federal agencies.
That said, the President retains his veto power on any legislation, and overriding it requires a two-thirds vote in each chamber, a hurdle the next Congress is unlikely to overcome, in our view. Notably, calls for higher corporate taxes, restored energy subsidies, or sweeping technology rules could grow louder in a Democrat controlled Congress. But any proposals drafted into legislation would still need the President's signature. Thus, investors should focus on measures with a credible path to becoming law under this scenario and discount rhetoric or legislation that are unlikely to alter the status quo. And in the possibility that bipartisan deals are struck in any combination of Congress over the next two years, investors will quickly look to assess if those agreements improve or worsen America’s fiscal standing, which is top-of-mind at the moment and unlikely to change, in our view.
And we would be remiss if we didn’t point out that an unexpected Republican hold of both chambers could reopen the path to more tax and spending changes through budget reconciliation, which lets qualifying measures pass the Senate with a simple majority. Nevertheless, investors would likely weigh any potential boost to corporate earnings or consumer spending from possible stimulus against the additional borrowing required to fund it.
At the end of the day, government gridlock over the next two years, regardless of Congress's exact composition, should slow “new” fiscal spending, in our view. In a small way, the market may look at that as a positive. Maybe, on the margins, it helps keep longer-term Treasury yields in check, at least aside from other factors currently driving rates. However, that composition is unlikely to help shrink the $40 trillion in outstanding U.S. government debt, meaningfully reduce deficit spending, alter the more than $1 trillion in U.S. annual interest expense, or provide a framework for building a more responsible fiscal roadmap. Admittedly, these might not be items for the next Congress to solve, but at some point, investors will expect our elected officials from all sides of the aisle to lead with greater fiscal discipline.
None of this means investors should brace for the worst. In fact, with the election noise soon set to clear, the market can more fully focus on the drivers that matter most for stocks (i.e., growth, profits, and the outlook ahead). Importantly, the U.S. economy continues to expand (up an impressive +3.4% in Q3), with heavy AI investment and a broadening recovery in industrial activity helping offset a softer consumer. Corporate profits are growing at an exceptional clip this year (up roughly +30% year-over-year in Q3) and expected to grow by double digits again next year. In our view, these forces will matter far more for stock prices over the next 12 months than what party holds the gavel in either chamber.
History also supports maintaining a constructive approach post-election. Between 1950 and 2022, the S&P 500 gained an average of +15.4% in the 12 months following a midterm election, according to Bloomberg and S&P Dow Jones Indices. Notably, in the eight midterms when the president's party lost control of at least one chamber, the most likely outcome this week, the Index averaged an almost +13% gain over the next year and finished higher every time, per Bloomberg. Granted, that's a small sample size, and each period carried its own market and economic dynamics. Nevertheless, once election uncertainty clears, investors have historically turned their attention back to the fundamentals that drive asset prices. In our view, investors who keep their politics largely separate from their investments tend to outperform those who let their party affiliation influence their portfolio and allocation decisions.
Bottom line: In part, Tuesday's results will likely decide who leads Washington's cost-of-living debate heading into the 2028 campaign. Yet the forces that drive stocks over time, including economic growth, corporate profits, and interest rates, will likely be shaped by dynamics outside Washington next year. With the economy expanding and companies continuing to grow profits, we believe the post-election backdrop gives investors more reason for optimism than this campaign season's tone suggests. That said, the tone around AI is shifting, and we see this, combined with higher interest rates, as the larger threats to market sentiment and fundamentals heading into next year. Nevertheless, once the votes are fully counted and investors know what Washington's composition will look like over the next couple of years, the focus will likely shift back to fundamentals. Historically, that shift has usually been good news for stocks in the year ahead.
The week ahead:
- The October employment report on Friday headlines a busy data week, with consensus looking for +40,000 payrolls and the unemployment rate to hold steady at 4.2%. ISM Manufacturing is out on Monday, JOLTS hits Tuesday, and ISM Services and ADP private payrolls are out on Wednesday.
- The U.S. Treasury will also release its quarterly refunding announcement on Wednesday.
- Earnings remain heavy, with about 140 S&P 500 companies reporting, including Apple, Palantir, Qualcomm, McDonald's, Uber, Booking Holdings, Amgen, and Pfizer.
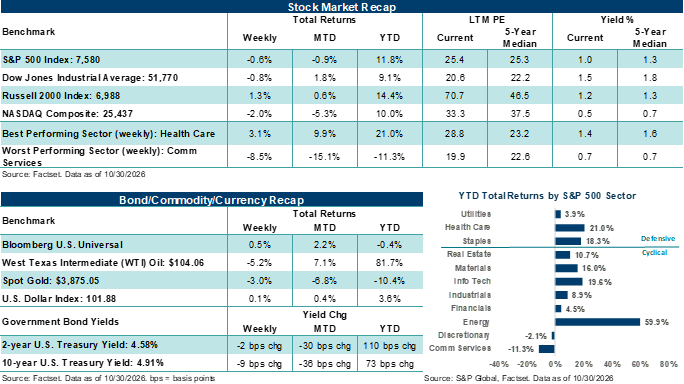
These figures are shown for illustrative purposes only and are not guaranteed. They do not reflect taxes or investment/product fees or expenses, which would reduce the figures shown here. An index is a statistical composite that is not managed. It is not possible to invest directly in an index. Past performance is not a guarantee of future results.
Important Disclosures
Sources: FactSet and Bloomberg. FactSet and Bloomberg are independent investment research companies that compile and provide financial data and analytics to firms and investment professionals such as Ameriprise Financial and its analysts. They are not affiliated with Ameriprise Financial, Inc.
The views expressed are as of the date given, may change as market or other conditions change, and may differ from views expressed by other Ameriprise Financial associates or affiliates. Actual investments or investment decisions made by Ameriprise Financial and its affiliates, whether for its own account or on behalf of clients, will not necessarily reflect the views expressed. This information is not intended to provide investment advice and does not account for individual investor circumstances.
Some of the opinions, conclusions and forward-looking statements are based on an analysis of information compiled from third-party sources. This information has been obtained from sources believed to be reliable, but accuracy and completeness cannot be guaranteed by Ameriprise Financial. It is given for informational purposes only and is not a solicitation to buy or sell the securities mentioned. The information is not intended to be used as the sole basis for investment decisions, nor should it be construed as advice designed to meet the specific needs of an individual investor.
Alternative investments cover a broad range of strategies and structures designed to be low or non-correlated to traditional equity and fixed-income markets with a long-term expectation of illiquidity. Alternative investments involve substantial risks and may be more volatile than traditional investments, making them more appropriate for investors with an above-average tolerance for risk.
Portfolios that hold a limited number of securities or concentrate investments in similar industries, sectors or geographical regions may experience greater volatility and greater risk of loss as the performance of these investments (either positive or negative) will have a greater impact on the portfolio as a whole.
International investing involves certain risks and volatility due to potential political, economic, social, or currency instabilities and different financial and accounting standards. These risks are enhanced for emerging markets.
Diversification does not assure a profit or protect against loss.
Commodity investments may be affected by the overall market and industry- and commodity-specific factors, and may be more volatile and less liquid than other investments.
There are risks associated with fixed-income investments, including credit (issuer default) risk, interest rate risk, and prepayment and extension risk. In general, bond prices rise when interest rates fall and vice versa. This effect is usually more pronounced for longer term securities.
Stock investments involve risk, including loss of principal. High-quality stocks may be appropriate for some investment strategies. Ensure that your investment objectives, time horizon and risk tolerance are aligned with investing in stocks, as they can lose value.
Investments in small cap companies involve risks and volatility greater than investments in larger, more established companies.
Generally, large-cap companies are more mature and have limited growth potential compared to smaller companies. In addition, large companies may not be able to adapt as easily to changing market conditions, potentially resulting in lower overall performance compared to the broader securities markets during different market cycles
The products of technology companies may be subject to severe competition and rapid obsolescence, and their stocks may be subject to greater price fluctuations.
Past performance is not a guarantee of future results.
An index is a statistical composite that is not managed. It is not possible to invest directly in an index.
Definitions of individual indices and sectors mentioned in this article are available on our website at ameriprise.com/legal/disclosures in the Additional Ameriprise research disclosures section.
The S&P 500 Index is a basket of 500 stocks that are considered to be widely held. The S&P 500 index is weighted by market value (shares outstanding times share price), and its performance is thought to be representative of the stock market as a whole. The S&P 500 index was created in 1957 although it has been extrapolated backwards to several decades earlier for performance comparison purposes. This index provides a broad snapshot of the overall US equity market. Over 70% of all US equity value is tracked by the S&P 500. Inclusion in the index is determined by Standard & Poor’s and is based upon their market size, liquidity, and sector.
The S&P 500 Equal Weight Index is the equal-weight version of the widely-used S&P 500. The index includes the same constituents as the capitalization weighted S&P 500, but each company in the S&P 500 EWI is allocated a fixed weight, or 0.2%, of the index total at each quarterly rebalance.
The NASDAQ Composite index measures all NASDAQ domestic and international based common type stocks listed on the Nasdaq Stock Market.
The Dow Jones Industrial Average (DJIA) is an index containing stocks of 30 Large-Cap corporations in the United States. The index is owned and maintained by Dow Jones & Company.
The Russell 2000 Index measures the performance of the small-cap segment of the US equity universe. The Russell 2000 is constructed to provide a comprehensive and unbiased small-cap barometer and is completely reconstituted annually to ensure larger stocks do not distort the performance and characteristics of the true small-cap opportunity set. The Russell 2000 includes the largest 2000 securities in the Russell 3000.
The US Dollar Index (USDX) indicates the general international value of the USD. The USDX does this by averaging the exchange rates between the USD and major world currencies. This is computed by using rates supplied by approximately 500 banks.
West Texas Intermediate (WTI) is a grade of crude oil commonly used as a benchmark for oil prices. WTI is a light grade with low density and sulfur content.
The Philadelphia Semiconductor Index (SOX) is a stock market index that tracks the performance of companies in the semiconductor (chip) industry.
Core PCE is a measure of inflation that tracks changes in the prices of goods and services purchased by consumers excluding food and energy prices.
Core CPI measures changes in the prices consumers pay for goods and services, excluding food and energy, to provide a clearer view of persistent inflation.
Core PPI (Core Producer Price Index) measures the average change over time in the prices received by producers for their goods and services, excluding food and energy prices.
Third party companies mentioned are not affiliated with Ameriprise Financial, Inc.
Investment products are not insured by the FDIC, NCUA or any federal agency, are not deposits or obligations of, or guaranteed by any financial institution, and involve investment risks including possible loss of principal and fluctuation in value.
Securities offered by Ameriprise Financial Services, LLC. Member FINRA and SIPC.
© 2026 Ameriprise Financial, Inc. All rights reserved.