Does AI have a math problem?
ANTHONY SAGLIMBENE – CHIEF MARKET STRATEGIST, AMERIPRISE FINANCIAL
WEEKLY MARKET PERSPECTIVES — September 29, 2026

U.S. stocks were mixed last week, with the S&P 500 Index and NASDAQ Composite both moving higher on strength in the AI trade, while the Russell 2000 Index fell as Treasury yields pushed to fresh post-financial-crisis highs. This week, August core PCE, ISM Manufacturing, and the September employment report will be in focus.
Last week in review:
- The S&P 500 rose +1.2%, the NASDAQ Composite gained +2.1%, and the Dow Jones Industrial Average added +0.3%. The Russell 2000 Index fell 0.8%. Technology, Communication Services, and Healthcare led sector performance, while Utilities, Energy, and Financials lagged.
- Treasury yields moved sharply higher, with the curve steepening. The 2-year Treasury yield briefly rose above 4.90%, its highest in more than two years, while the 10-year Treasury yield briefly pushed above 5.20%, setting new post-financial-crisis highs. The U.S. Dollar Index rose +0.7%. Gold fell 2.1%, and West Texas Intermediate (WTI) crude dropped 9.1%.
- The backup in yields was driven by stronger economic data, hawkish Fed speak, and soft Treasury auctions. The September flash composite PMI jumped to its highest level since July 2021, alongside rising input prices and supply chain bottlenecks. The 2-year, 5-year, and 7-year note auctions all tailed with below-average foreign participation. Fed officials reinforced their hawkish tone, with New York Fed President Williams saying it is reasonable to expect another rate hike by year-end and Governor Barr saying more hikes are needed. Markets are pricing a 66% chance of an October rate hike.
- AI developments were mixed but largely supportive. Meta Platforms rose +12.9% on momentum behind its new Muse personal AI agent. Microsoft advanced on expanded Copilot capabilities. On the cautious side, Oracle declared force majeure on a large New Mexico data center project over power and permitting constraints, highlighting growing infrastructure bottlenecks.
- Middle East headlines offered some temporary relief to energy markets, while Saudi Arabia rerouted shipments and resumed East-West pipeline flows. The Trump-Xi summit produced few concrete deliverables beyond a two-month extension of the trade truce.
“The required return on historic levels of AI investment and the absence of a productivity payoff yet are growing concerns investors shouldn’t gloss over at this point in the cycle. Heading into 2027, we believe investors should maintain diversified exposure to technology while favoring companies that can demonstrate AI spending translating into revenue, profits, and free cash flow.”
Anthony Saglimbene - Chief Market Strategist, Ameriprise Financial
Does AI have a math problem?
Last week, we noted that Oxford Economics estimates AI-related infrastructure spending will account for roughly +20% of U.S. economic growth this year and that the same spending underpins the vast majority of S&P 500 Index profit growth in 2026. This week, we thought we would take that point one step further. Thus, does the capital being committed to artificial intelligence (AI) add up against the economic gains and needed profits the technology is forecast to produce? Hence, does AI have a math problem?
Start with the scale of investment. Oxford estimates AI-related capex accounted for over one-quarter of total U.S. private fixed investment in Q2. Further, cumulative AI capex has added roughly +2.0% of U.S. GDP over the past three years, and hyperscaler investment alone is projected to reach +2.5% of U.S. GDP next year. As Oxford recently pointed out, across five technology-driven investment booms over the past two hundred years, only the UK railway mania of the 1840s was larger by this comparison.
And the projected path for the current AI buildout looks like it could get even steeper from here. Bloomberg estimates 2026 capex across the five core U.S. hyperscalers (i.e., Amazon, Alphabet, Meta Platforms, Microsoft, and Oracle) at $729 billion, rising to nearly $1.1 trillion in 2027. Notably, the spending side of the AI equation is still accelerating, which, from an investment standpoint, compounds the required return to justify the spend, in our view.
Interestingly, technological booms have tended to peak after three to five years and have historically ended abruptly. And investors who lived through the dotcom era certainly don’t need a reminder of what happens when reality meets inflated near- to intermediate-term expectations for a new technology. Outside of that more recent history, Oxford notes the second UK railway bust cut UK GDP by around 6.0% relative to trend by 1850. Closer to home, U.S. railway company defaults surged in the 1870s after a wave of heavy investment. As we have highlighted in the past, these examples of overinvestment ended poorly for the builders, even though the underlying technology delivered enormous long-term benefits.
So, what might help extend the current expansion of AI investment, and possibly avoid or delay the more negative outcomes for investors? In two words: “productivity” and “profitability”.
During the dotcom boom, tech-sector investment growth accelerated to a +25% annual rate, and aggregate productivity gains appeared quickly. By 1998, the five-year average growth in utilization-adjusted total factor productivity (TFP) (i.e., a measure that adjusts for swings in labor and capital utilization) reached an annual rate of +1.5%, compared with roughly zero over 1993-1997. It climbed to +2.5% by 2002 before fading lower. Basically, higher capex and labor efficiency led to greater productivity during the early and mid-part of the dot-com era, at least for a period.
Fast forward to today, and Oxford estimates AI-related investment growth is running at a similar clip, but with no aggregate productivity bonus currently visible. And the San Francisco Fed's own utilization-adjusted TFP measure slowed sharply from +1.7% in 2024 to just +0.3% in 2025 and has since turned negative. Further, labor productivity, as measured by the Bureau of Labor Statistics, has slowed since 2025. Taken together, different measures of productivity are decelerating or not expanding during one of the heaviest capex cycles on record. As several Federal Reserve officials have noted this year, the productivity payoff of AI mostly lies ahead, and gains visible in particular firms and sectors have not yet appeared at the aggregate level.
While official measures of productivity can be revised over time (and actually show growth in hindsight), AI bulls would argue that there is real-world evidence that the technology’s benefits are accumulating quickly as adoption continues to broaden. A recent Census Bureau survey puts U.S. corporate AI adoption at roughly 20% as of June, rising to 37% among firms with 250 or more employees. Additionally, 31% of working-age Americans now use generative AI tools, per Microsoft data.
But outside of Technology, where the usage benefits are more direct and easier to measure, we believe bottom-line results for most of corporate America are still taking form. For example, Pharmaceutical R&D is expected to see AI improve a historically weak 3-5% return on R&D investment and could generate sector-wide cost savings over the coming years. In food service, operating margins are expected to improve through AI-driven process and inventory management, while telecommunications executives are beginning to report greater visibility into AI returns and efficiencies. At a higher level, Bloomberg noted that strong evidence of broad margin benefits has yet to materialize across global bellwether companies, something investors are likely banking on given the extraordinary investment in AI.
While the AI cycle may still be in the early innings, roughly four years into the AI boom, measurable benefits to productivity and corporate profits outside of Tech remain difficult to quantify. If this trend continues through next year, we suspect skepticism about the intermediate benefits of AI relative to spending will grow and could become a larger issue for the market as a whole.
So, let’s address the potential math problem. Hyperscaler investment this year is estimated to approach 50% of revenue, above the peak reached by telecom firms a quarter century ago. Free cash flow across those firms is estimated to fall from $200 billion in 2025 to negative $40 billion this year. Consensus forecasts call for it to recover above $500 billion by 2030 as capital spending flattens and AI demand and monetization accelerate. Earning the 15% to 20% returns these companies are targeting on roughly $3.8 trillion in forecasted cumulative investment from 2024 through 2028 would require approximately $570 billion to $800 billion in additional annual profit, according to Oxford.
Yet AI is estimated to add $850 billion to annual U.S. economic output by 2032. For scale, the estimated $570 billion to $800 billion of additional annual profit equals roughly two-thirds to nearly all of that projected increase in annual output. Of course, profit and economic output are different measures, but the comparison puts the scale of the required returns in perspective. Reaching those returns would also require sustained pricing power and substantial margins from AI companies. We believe that combination is unlikely to hold as the technology matures.
Again, the bulls would counter and say AI firms are highly profitable today, and these estimates are just that, estimates. Subject to change as growth and profits become more visible. But we believe two issues could complicate that view over time. Some companies are delaying depreciation charges, which flatter near-term profits today. Those charges could become a drag on earnings at some point in the future. And a substantial share of hyperscaler revenue is circular (as we highlighted a few weeks ago), booking sales today against cash flows that arrive later. Importantly, similar dynamics inflated results when telecom firms extended vendor credit to their own customers in the late 1990s and when utility holding companies operated comparable circular structures in the 1920s. Both magnified investment losses once assumptions were reduced.
Finally, the risks aren't confined to just hyperscalers. Capital market fatigue is already building as AI debt issuance grows and off-balance-sheet lease commitments (which are difficult to track) pile up across the market. Rising interest rates punctured both the dotcom boom and the 1800’s railway mania, and our base assumption is that U.S. rates will likely remain higher for longer absent an economic downturn. Meanwhile, a large buildout of data center capacity is underway, financed based on what may prove to be aggressive AI demand forecasts, which has pulled Utilities and Industrials into the same exposure.
Bottom line: In our view, a potential correction in AI requires only that returns on investment disappoint against what is priced today. Yes, adoption is broadening, and use-case-specific returns are beginning to show up. Areas of tech are growing profits aggressively (a reason to stay invested in the theme), and the technology is bound to enhance the economy and a broader set of industries beyond tech over time. As such, we believe that recognizing the risks while maintaining a favorable view of diversified technology exposure in a portfolio continues to make sense for most investors today.
That said, the required return on historic levels of AI investment and the absence of a productivity payoff yet are growing concerns investors shouldn’t gloss over at this point in the cycle. Heading into 2027, we believe investors should maintain diversified exposure to technology while favoring companies that can demonstrate AI spending translating into revenue, profits, and free cash flow. More broadly, we believe investors will increasingly expect companies across industries to demonstrate how AI investments are improving their bottom lines. The clock is ticking.
The week ahead:
- The September employment report on Friday headlines the week, with FactSet estimates looking for +90,000 payrolls, an unemployment rate of 4.1%, and average hourly earnings up +0.3% month over month.
- August core PCE and ADP private payrolls are due Wednesday, followed by September ISM Manufacturing on Thursday. September consumer confidence and August JOLTS are out on Tuesday.
- Earnings include Carnival Corp on Tuesday, Micron Technology on Wednesday, and Nike on Thursday.
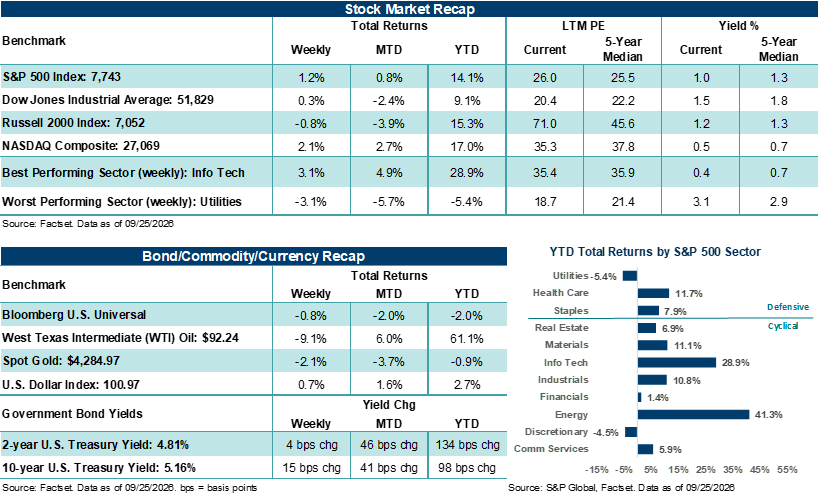
These figures are shown for illustrative purposes only and are not guaranteed. They do not reflect taxes or investment/product fees or expenses, which would reduce the figures shown here. An index is a statistical composite that is not managed. It is not possible to invest directly in an index. Past performance is not a guarantee of future results.
Important Disclosures
Sources: FactSet and Bloomberg. FactSet and Bloomberg are independent investment research companies that compile and provide financial data and analytics to firms and investment professionals such as Ameriprise Financial and its analysts. They are not affiliated with Ameriprise Financial, Inc.
The views expressed are as of the date given, may change as market or other conditions change, and may differ from views expressed by other Ameriprise Financial associates or affiliates. Actual investments or investment decisions made by Ameriprise Financial and its affiliates, whether for its own account or on behalf of clients, will not necessarily reflect the views expressed. This information is not intended to provide investment advice and does not account for individual investor circumstances.
Some of the opinions, conclusions and forward-looking statements are based on an analysis of information compiled from third-party sources. This information has been obtained from sources believed to be reliable, but accuracy and completeness cannot be guaranteed by Ameriprise Financial. It is given for informational purposes only and is not a solicitation to buy or sell the securities mentioned. The information is not intended to be used as the sole basis for investment decisions, nor should it be construed as advice designed to meet the specific needs of an individual investor.
Alternative investments cover a broad range of strategies and structures designed to be low or non-correlated to traditional equity and fixed-income markets with a long-term expectation of illiquidity. Alternative investments involve substantial risks and may be more volatile than traditional investments, making them more appropriate for investors with an above-average tolerance for risk.
Portfolios that hold a limited number of securities or concentrate investments in similar industries, sectors or geographical regions may experience greater volatility and greater risk of loss as the performance of these investments (either positive or negative) will have a greater impact on the portfolio as a whole.
International investing involves certain risks and volatility due to potential political, economic, social, or currency instabilities and different financial and accounting standards. These risks are enhanced for emerging markets.
Diversification does not assure a profit or protect against loss.
Commodity investments may be affected by the overall market and industry- and commodity-specific factors, and may be more volatile and less liquid than other investments.
There are risks associated with fixed-income investments, including credit (issuer default) risk, interest rate risk, and prepayment and extension risk. In general, bond prices rise when interest rates fall and vice versa. This effect is usually more pronounced for longer term securities.
Stock investments involve risk, including loss of principal. High-quality stocks may be appropriate for some investment strategies. Ensure that your investment objectives, time horizon and risk tolerance are aligned with investing in stocks, as they can lose value.
Investments in small cap companies involve risks and volatility greater than investments in larger, more established companies.
Generally, large-cap companies are more mature and have limited growth potential compared to smaller companies. In addition, large companies may not be able to adapt as easily to changing market conditions, potentially resulting in lower overall performance compared to the broader securities markets during different market cycles
The products of technology companies may be subject to severe competition and rapid obsolescence, and their stocks may be subject to greater price fluctuations.
Past performance is not a guarantee of future results.
An index is a statistical composite that is not managed. It is not possible to invest directly in an index.
Definitions of individual indices and sectors mentioned in this article are available on our website at ameriprise.com/legal/disclosures in the Additional Ameriprise research disclosures section.
The S&P 500 Index is a basket of 500 stocks that are considered to be widely held. The S&P 500 index is weighted by market value (shares outstanding times share price), and its performance is thought to be representative of the stock market as a whole. The S&P 500 index was created in 1957 although it has been extrapolated backwards to several decades earlier for performance comparison purposes. This index provides a broad snapshot of the overall US equity market. Over 70% of all US equity value is tracked by the S&P 500. Inclusion in the index is determined by Standard & Poor’s and is based upon their market size, liquidity, and sector.
The NASDAQ Composite index measures all NASDAQ domestic and international based common type stocks listed on the Nasdaq Stock Market.
The Dow Jones Industrial Average (DJIA) is an index containing stocks of 30 Large-Cap corporations in the United States. The index is owned and maintained by Dow Jones & Company.
The Russell 2000 Index measures the performance of the small-cap segment of the US equity universe. The Russell 2000 is constructed to provide a comprehensive and unbiased small-cap barometer and is completely reconstituted annually to ensure larger stocks do not distort the performance and characteristics of the true small-cap opportunity set. The Russell 2000 includes the largest 2000 securities in the Russell 3000.
The US Dollar Index (USDX) indicates the general international value of the USD. The USDX does this by averaging the exchange rates between the USD and major world currencies. This is computed by using rates supplied by approximately 500 banks.
West Texas Intermediate (WTI) is a grade of crude oil commonly used as a benchmark for oil prices. WTI is a light grade with low density and sulfur content.
Utilization-adjusted total factor productivity (TFP) aims to measure underlying productivity improvements, such as those from technology, innovation, or better business processes, while filtering out productivity changes caused merely by factories, equipment, or workers being used more or less intensively.
Third party companies mentioned are not affiliated with Ameriprise Financial, Inc.
Investment products are not insured by the FDIC, NCUA or any federal agency, are not deposits or obligations of, or guaranteed by any financial institution, and involve investment risks including possible loss of principal and fluctuation in value.
Securities offered by Ameriprise Financial Services, LLC. Member FINRA and SIPC.
© 2026 Ameriprise Financial, Inc. All rights reserved.