What the internet boom can tell us about the AI boom
ANTHONY SAGLIMBENE – CHIEF MARKET STRATEGIST, AMERIPRISE FINANCIAL
WEEKLY MARKET PERSPECTIVES — August 10, 2026

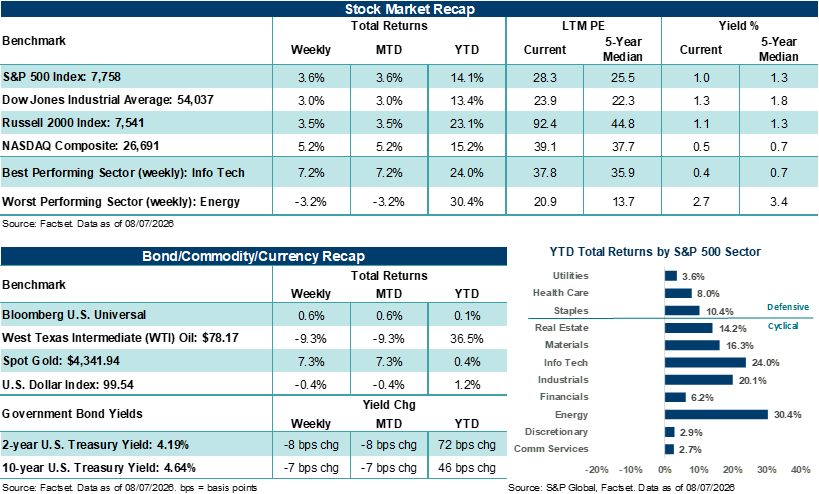
U.S. stocks moved sharply higher last week, with the S&P 500 Index closing at a fresh record high and posting its strongest week since April. This week, July CPI and retail sales headline the economic calendar as the second-quarter earnings season winds down.
Last week in review:
- The S&P 500 Index rose +3.6% last week, the NASDAQ Composite gained +5.2%, the Dow Jones Industrial Average added roughly +3.0%, and the Russell 2000 Index climbed +3.5%. Technology and Materials led all sectors, while Energy lagged alongside a decline in crude prices.
- Treasury prices firmed across the curve, with the 30-year Treasury yield easing from its post-2007 highs. The U.S. Dollar Index fell 0.4%, with a joint U.S./Japan intervention to support the yen the dominant FX story. Gold rose +7.3%, its best week since January. West Texas Intermediate (WTI) crude fell 9.3%, its second straight weekly decline.
- The July jobs report came in much weaker than expected. Nonfarm payrolls contracted by 23,000, the first decline since February and well below expectations for +80,000, with a combined 103,000 in downward revisions to May and June. The unemployment rate fell to 4.1%, though the drop was helped by another decline in labor force participation. Elsewhere, July ISM Manufacturing rose to its highest level since May 2022, while ISM Services stayed in expansion but came in a bit softer than forecast.
- Second-quarter earnings remained a bright spot. With 88% of the S&P 500 reported, Q2 blended earnings per share growth is running at +50.4% year-over-year, well ahead of pre-season expectations. Excluding the large contributions from Alphabet and Amazon, Q2 profit growth is still up +29.2%, above the five- and ten-year averages, while blended revenue growth is higher by +15.0%.
- Middle East developments remained in focus. Headlines centered on a possible Iran/Oman deal to reopen the Strait of Hormuz under joint oversight, though the proposed terms were viewed as unworkable by the shipping industry and unlikely to be acceptable to the U.S. Reports also noted that the U.S. was running low on critical munitions, a dynamic that could limit military pressure on Tehran.
“History won’t tell us what happens next in the AI cycle. However, history sometimes rhymes, and some careful perspective might help inform what to monitor this go around.”
Anthony Saglimbene - Chief Market Strategist, Ameriprise Financial
What the Internet Boom can tell us about the AI Boom
The NASDAQ Composite has climbed over +130% since OpenAI released ChatGPT in late November 2022. Set on a similar starting clock, the Internet Boom carried the Composite up a little more than +145% by the same point in its run, mid-1998, measured from the arrival of the Netscape Navigator web browser in late 1994. Two cycles, roughly a generation apart, arriving at nearly the same place over their respective tech booms. We keep this comparison alive in our commentary from time to time because we believe the return paths rhyme and because the road the Internet Boom took after this point can offer a valuable perspective for the AI Boom moving forward.
Start with how each tech cycle reached its respective 900th trading day, more or less. As we have referenced in these pages before, the Internet Boom's spark was Netscape Navigator, the first modern web browser most people used, and the software that turned the Internet from a research tool into something an ordinary household could use. When Netscape Communications sold shares to the public in August 1995, the stock more than doubled on its first day of trading, and Wall Street quickly recognized that the Internet was a new and emerging commercial platform. As such, early market leadership sat in the plumbing of the new network, the routers and switches that carried the traffic, led by Cisco Systems, before Microsoft turned its full weight toward the web with its own browser, Internet Explorer.
As most know today, the AI Boom's spark was ChatGPT, a “free” chatbot that answered questions in plain language and reached 100 million users in just two months, the fastest any consumer product had ever spread at the time. As most also understand, early market leadership was held by NVIDIA, the chipmaker whose processors train these systems. NVIDIA became the first chip company worth $1 trillion and, more recently, the first worth $5 trillion. Different sparks, different eras, but the same pattern. The market generally rewards the builders of transformative technology first.
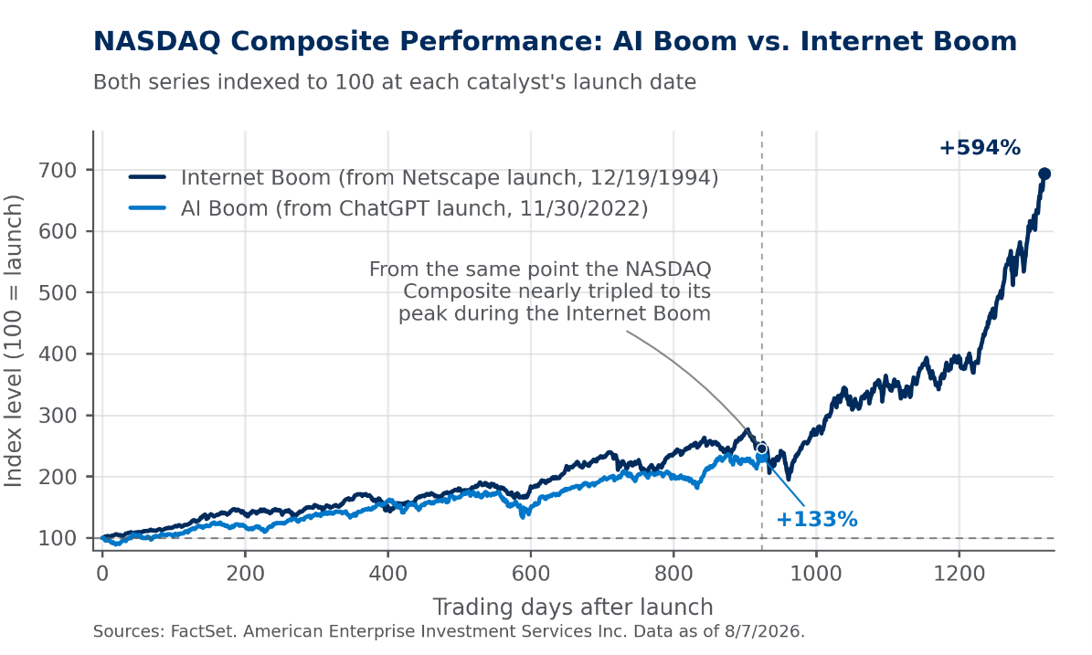
Notably, both cycles took their punches and kept progressing at this same point in their arch. The Internet Boom absorbed a sharp pullback in 1996 and the Asian financial crisis in 1997 without losing the secular narrative. For its part, the AI Boom has absorbed several rate and market shocks, disruptive geopolitical events, and the DeepSeek shock in early 2025, when a low-cost Chinese AI model wiped close to $600 billion off NVIDIA in a single session. This year has delivered similar tests in the same rhythm but on a smaller scale. A first-quarter tech selloff, a second-quarter recovery to fresh records, a mid-summer bear market in semiconductor and memory stocks, and now a recent August melt-up that has added trillions in value. With each blow, the AI narrative endures. And as a point of historical context, at this point in the Internet Boom, the market was sitting on the doorstep of Russia’s default and the Long-term Capital Management shock. At the end of August 1998, the NASDAQ Composite lost over 8.5% in a single session. Yet, the Composite eventually staged a historic rebound, and the Internet narrative endured. Something to keep in mind if other outside forces temporarily press against the AI Boom from here.
But it’s also important to recognize what’s different between the two tech eras. The first cycle's leadership was broad. Dozens of networking and telecom companies eventually carried out the internet buildout. In contrast, this cycle's leadership has been narrower. The AI Boom started with NVIDIA and has since broadened to a smaller group of hardware winners, including chip designers, memory makers, networking giants, and chip factories. That said, it remains a tighter roster of winners compared to the 1990s, at least so far. Simply put, the magnitude of the market move during the AI Boom is concentrated among fewer companies, though this year the market's winners are starting to spill out of tech directly.
The level of spending is another notable difference, and, as we have routinely noted, the current AI cycle dwarfs the internet cycle. In 1995, the U.S. telecom industry spent $47 billion in capital investment, peaking at $121 billion in 2000, according to the San Francisco Federal Reserve. The industry spent over $440 billion in total between 1996 and 2000. Fast forward, and the largest cloud companies, Microsoft, Amazon, Alphabet, and Meta Platforms, are spending over $800 billion on AI in 2026 alone, headed toward $1 trillion next year.
The third key difference is that this cycle's leaders can be named by even casual investors, and named leaders can diverge as the cycle matures. For example, Microsoft is higher by +30% over the last month while Tesla is down 19%. The Magnificent Seven has seen diverging performance all year, possibly indicating that simply owning a well-known basket of AI winners may no longer return the same benefits it did earlier in the cycle.
There are also more complex risks in this cycle than in the 1990s. A difficult-to-track web of financing among the largest players in AI has investors intently watching for circular deals, where the same dollars cycle among chipmaker, cloud provider, and startup. And a shift toward borrowing to fund the AI buildout is also a growing risk. Power and grid capacity add a hard physical limit. And a political overlay, from government model reviews to export controls to proposals to tax AI revenue, complicates the road from here.
But we believe it’s important to note that when the Internet Boom reached this same milestone, it wasn't finished. The Composite nearly tripled from here into its early-2000 peak, and most of that gain arrived in the final stretch of the dotcom bubble. Of course, well-seasoned investors also know that the eventual reckoning led to a decline of roughly 80% in the NASDAQ Composite from peak to trough.
Importantly, history won’t tell us what happens next in the AI cycle. However, history sometimes rhymes, and some careful perspective might help inform what to monitor this go around. The market has stopped rewarding AI participation and started rewarding execution. Below is an “eyes-wide-open” assessment of what we believe is worth watching as the AI cycle continues to mature.
- Capex needs to convert to increased revenue. The four largest cloud companies are spending hundreds of billions on AI this year, close to their combined operating cash flow, which leaves free cash flow near zero. We believe the AI cycle can remain healthy as long as cloud revenue growth outpaces spending. Azure grew +43% and Amazon Web Services +37% last quarter, both quickening, with cloud margins near 40%. For the hyperscalers, that’s probably going to remain the clearest measure to watch if AI spending is converting into real demand. However, if the AI revenue can’t keep justifying the spending, the cycle might enter a more precarious phase, in our view.
- The demand backlog behind the spending. According to Bloomberg, the combined cloud order backlog at the top players recently reached over $2.0 trillion, up +175% from a year ago, giving multi-year revenue visibility. A slowdown in backlog growth, or a sudden decay, would flash a warning well before revenue shows it.
- Chinese price competition. Chinese models from DeepSeek and Moonshot are landing near U.S. AI benchmarks at a fraction of the cost. When Moonshot released Kimi K3 in July, it triggered a tech selloff. If inference prices collapse, the return on all this infrastructure spending gets harder to justify. Watch whether U.S. AI leaders start competing on price rather than capability to protect their moats.
- How the buildout is financed. Alphabet raised more than $80 billion in equity to fund AI spending in the same quarter it reported its first negative free cash flow as a public company, and NVIDIA is reportedly arranging deals worth over $750 billion that would help finance its own customers. Watch AI bond spreads and equity issuance, and remember that the binding constraint for all this reported AI demand includes physical locations, power, cooling, and memory.
- The application handoff. In the Internet Boom, the durable money, into and after the bust, was made not by the infrastructure names but by the companies built on top of that infrastructure (ex., Amazon and Google). The AI equivalents have not been settled on or might not even exist today. While it may take quarters or even years, watch for application areas and companies to begin to outperform the chipmakers. In the last cycle, that handoff started before the bust.
Bottom line: In the late 1990s, most of the Internet Boom’s gains were ahead of it, and the cycle’s peak still lay ahead. That could be the case for the AI cycle as well. However, what’s different this time is that a narrower, more leveraged, and more physically constrained set of leaders dominates the market, which means the same history could move faster both up and down. We believe the next phase of the current cycle turns less on the AI story itself and more on which leaders convert record spending into returns and which companies (possibly not even within tech) find new ways to profit from the technology. As this year’s market action has started to show, investors may already have started grading on that curve.
The week ahead:
- July CPI on Wednesday and July retail sales on Friday headline the economic calendar, with July PPI on Thursday and preliminary August University of Michigan consumer sentiment on Friday rounding out the key releases.
- The U.S. Treasury will auction $125 billion in new debt, including $58 billion in 3-year notes, $42 billion in 10-year notes, and $25 billion in 30-year bonds.
- The second-quarter earnings season begins to slow this week, with Cisco, Applied Materials, Ross Stores, Simon Property Group, and CoreWeave among the larger names reporting.
These figures are shown for illustrative purposes only and are not guaranteed. They do not reflect taxes or investment/product fees or expenses, which would reduce the figures shown here. An index is a statistical composite that is not managed. It is not possible to invest directly in an index. Past performance is not a guarantee of future results.
Sources: FactSet and Bloomberg. FactSet and Bloomberg are independent investment research companies that compile and provide financial data and analytics to firms and investment professionals such as Ameriprise Financial and its analysts. They are not affiliated with Ameriprise Financial, Inc.
The views expressed are as of the date given, may change as market or other conditions change, and may differ from views expressed by other Ameriprise Financial associates or affiliates. Actual investments or investment decisions made by Ameriprise Financial and its affiliates, whether for its own account or on behalf of clients, will not necessarily reflect the views expressed. This information is not intended to provide investment advice and does not account for individual investor circumstances.
Some of the opinions, conclusions and forward-looking statements are based on an analysis of information compiled from third-party sources. This information has been obtained from sources believed to be reliable, but accuracy and completeness cannot be guaranteed by Ameriprise Financial. It is given for informational purposes only and is not a solicitation to buy or sell the securities mentioned. The information is not intended to be used as the sole basis for investment decisions, nor should it be construed as advice designed to meet the specific needs of an individual investor.
Alternative investments cover a broad range of strategies and structures designed to be low or non-correlated to traditional equity and fixed-income markets with a long-term expectation of illiquidity. Alternative investments involve substantial risks and may be more volatile than traditional investments, making them more appropriate for investors with an above-average tolerance for risk.
Portfolios that hold a limited number of securities or concentrate investments in similar industries, sectors or geographical regions may experience greater volatility and greater risk of loss as the performance of these investments (either positive or negative) will have a greater impact on the portfolio as a whole.
International investing involves certain risks and volatility due to potential political, economic, social, or currency instabilities and different financial and accounting standards. These risks are enhanced for emerging markets.
Diversification does not assure a profit or protect against loss.
Commodity investments may be affected by the overall market and industry- and commodity-specific factors, and may be more volatile and less liquid than other investments.
There are risks associated with fixed-income investments, including credit (issuer default) risk, interest rate risk, and prepayment and extension risk. In general, bond prices rise when interest rates fall and vice versa. This effect is usually more pronounced for longer term securities.
Stock investments involve risk, including loss of principal. High-quality stocks may be appropriate for some investment strategies. Ensure that your investment objectives, time horizon and risk tolerance are aligned with investing in stocks, as they can lose value.
Investments in small cap companies involve risks and volatility greater than investments in larger, more established companies.
Generally, large-cap companies are more mature and have limited growth potential compared to smaller companies. In addition, large companies may not be able to adapt as easily to changing market conditions, potentially resulting in lower overall performance compared to the broader securities markets during different market cycles
The products of technology companies may be subject to severe competition and rapid obsolescence, and their stocks may be subject to greater price fluctuations.
Past performance is not a guarantee of future results.
An index is a statistical composite that is not managed. It is not possible to invest directly in an index.
Definitions of individual indices and sectors mentioned in this article are available on our website at ameriprise.com/legal/disclosures in the Additional Ameriprise research disclosures section.
The S&P 500 Index is a basket of 500 stocks that are considered to be widely held. The S&P 500 index is weighted by market value (shares outstanding times share price), and its performance is thought to be representative of the stock market as a whole. The S&P 500 index was created in 1957 although it has been extrapolated backwards to several decades earlier for performance comparison purposes. This index provides a broad snapshot of the overall US equity market. Over 70% of all US equity value is tracked by the S&P 500. Inclusion in the index is determined by Standard & Poor’s and is based upon their market size, liquidity, and sector.
The NASDAQ Composite index measures all NASDAQ domestic and international based common type stocks listed on the Nasdaq Stock Market.
The Dow Jones Industrial Average (DJIA) is an index containing stocks of 30 Large-Cap corporations in the United States. The index is owned and maintained by Dow Jones & Company.
The Russell 2000 Index measures the performance of the small-cap segment of the US equity universe. The Russell 2000 is constructed to provide a comprehensive and unbiased small-cap barometer and is completely reconstituted annually to ensure larger stocks do not distort the performance and characteristics of the true small-cap opportunity set. The Russell 2000 includes the largest 2000 securities in the Russell 3000.
The US Dollar Index (USDX) indicates the general international value of the USD. The USDX does this by averaging the exchange rates between the USD and major world currencies. This is computed by using rates supplied by approximately 500 banks.
West Texas Intermediate (WTI) is a grade of crude oil commonly used as a benchmark for oil prices. WTI is a light grade with low density and sulfur content.
The Philadelphia Semiconductor Index (SOX) is a stock market index that tracks the performance of companies in the semiconductor (chip) industry.
A capitalization-weighted index assigns each company a weight based on its total market value (market capitalization). Companies with larger market capitalizations have a greater influence on the index's performance than smaller companies.
An equal-weighted index assigns the same weight to every company in the index, regardless of its market capitalization.
Third party companies mentioned are not affiliated with Ameriprise Financial, Inc.
Investment products are not insured by the FDIC, NCUA or any federal agency, are not deposits or obligations of, or guaranteed by any financial institution, and involve investment risks including possible loss of principal and fluctuation in value.
Securities offered by Ameriprise Financial Services, LLC. Member FINRA and SIPC.
© 2026 Ameriprise Financial, Inc. All rights reserved.