It paid to stay in May. But June may want the receipts.
ANTHONY SAGLIMBENE – CHIEF MARKET STRATEGIST, AMERIPRISE FINANCIAL
WEEKLY MARKET PERSPECTIVES — JUNE 1, 2026

The S&P 500 Index and NASDAQ Composite both ended last week at fresh record highs, with the S&P 500 rising for a ninth straight week and the NASDAQ posting gains for the eighth time in nine weeks. This week, the May employment report, ISM data, JOLTS, and a handful of late-cycle earnings reports will help shape the narrative.
Last week in review:
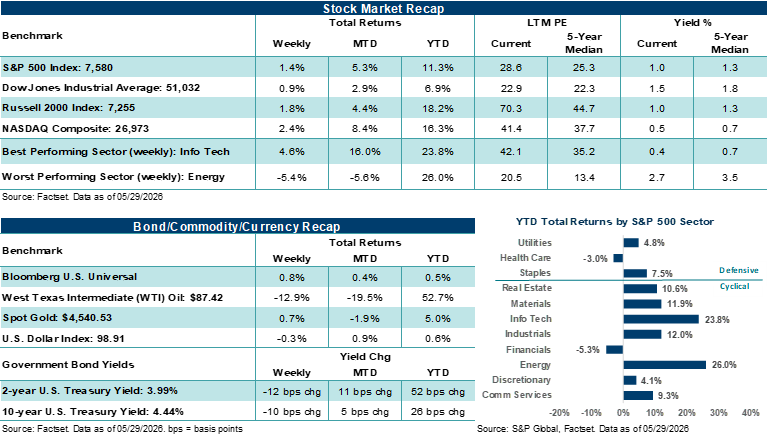
- Momentum stocks led gains, with semiconductors and memory stocks outperforming. Technology was the strongest S&P 500 sector, helped by Microsoft, software, and strength in AI-linked hardware. Consumer Discretionary also outperformed, while Energy, Consumer Staples, Utilities, Real Estate, and Financials lagged. The Russell 2000 Index and Dow Jones Industrial Average also posted solid gains.
- Treasury prices firmed across the curve, with the 2-year Treasury yield moving back below 4.0%, while the 10-year Treasury yield fell below 4.50%. The U.S. Dollar Index slipped, Gold rose, and West Texas Intermediate (WTI) crude fell 12.9%. Treasury yields and oil prices moved lower amid improving headlines out of the Middle East.
- Economic data kept the inflation and consumer debate active. April core Personal Consumption Expenditures (PCE) inflation rose +3.3% year-over-year, its highest reading since November 2023. And retail earnings were mixed, while softer real consumer spending and a lower savings rate pointed to more strain beneath the surface.
- Notably, geopolitical headlines turned more constructive, as the U.S. and Iranian negotiators reached an agreement on a 60-day memorandum of understanding to extend the ceasefire, though final approval from President Trump is pending
“June could tell us a lot about whether the pillars of support that carried stocks through May can hold as summer kicks off.”
Anthony Saglimbene - Chief Market Strategist, Ameriprise Financial
It paid to stay in May. But June may want the receipts.
Wall Street’s adage of Sell in May and Go Away, didn’t work out so hot this year, at least during the first month of the annual six-month stretch. For the record, we believe investors should ignore such tropes. That said, stocks had several reasons to stall in May after the S&P 500 Index rose by more than +10% in April. Inflation reaccelerated across both consumer and producer measures in April, with headline readings hitting their highest levels in roughly three years. Consumer sentiment fell to a record low. The 30-year U.S. Treasury yield touched levels not seen since 2007. And the U.S. remained engaged in an active military conflict with Iran, with the Strait of Hormuz effectively closed for most of May. Yet the S&P 500 Index rose by more than +5.0% last month, the NASDAQ Composite gained more than +8.0%, and both Indexes closed at fresh all-time highs. In addition, the Dow reclaimed 50,000 after losing the level during the March sell-off. Coming off the strongest April since 2020, the natural expectation was consolidation, not continuation. So, what carried stocks through a wall of worry that, on paper, looked pretty formidable?
The short answer is earnings, something we’ve highlighted repeatedly over recent weeks. Q1 S&P 500 results delivered the strongest profit growth since late 2021, more than doubling what analysts had expected just two months earlier. Margins expanded to record levels. And revenue growth was the best in nearly four years. Notably, the profit strength wasn't confined to a handful of mega-cap technology names. Financials, Industrials, and several other cyclical sectors posted double-digit earnings gains in Q1, giving the rally a broader fundamental base than many investors assumed. In our view, the earnings cycle gave the market permission to look past elevated inflation readings and rising rate expectations. Bottom line: When companies are growing profits at this pace, investors tend to tolerate added discomfort elsewhere. That said, stock price returns in May remained very concentrated in Technology, with eight of eleven sectors actually finishing the month lower.
The other key driver of market momentum in May was the reversal in oil prices. WTI crude fell over 19% during the month, dropping from above $105 per barrel to the high-$80s by month-end. The decline was largely due to diplomatic progress on a potential U.S./Iran memorandum of understanding that, if finalized, could reopen the Strait of Hormuz and create a framework for future nuclear negotiations. Although the deal wasn't done by month-end, and U.S. military strikes on Iranian launch sites and mine-laying operations complicated the picture, the directional shift was notable all month. Importantly, falling oil prices gave the bond market room to breathe after weeks of relentless selling. The 10-year U.S. Treasury yield, which had climbed to levels last seen in early 2025 by mid-May, retreated 22 basis points by month-end. And a mostly inline core PCE reading late in the month added to the narrative that the worst of the energy-driven inflation pass-through effects may be cresting. For a market that had been bracing for something closer to stagflationary conditions in May, the combination of falling crude and mostly as expected inflation data acted to calm investors.
However, beneath the surface, the picture looks a little more complicated as the calendar turns to June. The U.S. economy is growing, with the latest Atlanta Fed GDPNow forecast pointing to +3.8% growth in Q2, though the distribution of that growth could remain narrow like in Q1. Currently, higher-income, asset-rich households are largely insulated by the wealth effect of record stock prices and stable employment. Lower-income consumers, on the other hand, are absorbing a disproportionate share of the energy and inflation shock. Gasoline prices remained well above $4.00 per gallon throughout May. Real wages turned negative as income growth fell behind inflation. And serious credit card delinquencies for certain borrower cohorts are approaching levels not seen since the Great Recession. That is, record-low consumer sentiment measures aren’t just noise. Instead, they echo hard data dynamics that reflect real pressures of higher prices for a meaningful portion of the population that simply isn't participating in the market's rally. The “K-shaped” dynamic that has defined this cycle as of late, both within the economy and in the stock market, widened further in May.
Importantly, the AI capital spending cycle continues to act as the market's center of gravity. Hyperscaler capex budgets are on pace to set records this year, and every major cloud provider signaled that demand for AI infrastructure remains supply-constrained. NVIDIA posted record profits and guided well above expectations last month. Yet, the stock's muted post-earnings reaction for a fourth consecutive quarter suggests the market is now pricing execution, not upside surprise.
That said, the opportunity set is broadening beyond semiconductors into networking, memory, and power delivery. In addition, a wave of planned mega-cap AI IPOs is already changing how index providers think about inclusion rules. Notably, the top ten stocks in the S&P 500 now account for a larger share of the Index's market cap than at the peak of the dot-com era, and just a little more than half of constituents were trading above their 50-day moving average even as the Index printed new highs last month. Nevertheless, we believe the fundamental case for stocks remains intact, supported by record earnings, broadening AI investment, and the potential for lower energy prices if U.S./Iran diplomacy holds. But the conditions around that case have shifted. Valuations are full. Rate expectations have repriced higher. The consumer is split. And the margin for error, after a rally of this magnitude off the March lows, has narrowed.
Looking ahead: June could tell us a lot about whether the pillars of support that carried stocks through May can hold as summer kicks off. Interestingly, the S&P 500 has closed the final month of the second quarter higher in nine of the last ten years. Importantly, the Federal Reserve will likely hold rates steady on June 17 with a new chair at the helm, a fresh set of economic projections, and an inflation picture that remains unsettled. In our view, Kevin Warsh inherits a divided committee where the conversation has moved from when to cut rates to whether rate cuts are even on the table this year. How he frames that shift in his first press conference this month will matter far more to investors than the rate decision itself.
At the same time, the U.S./Iran situation enters June unresolved and, in our view, represents a significant binary risk for markets right now. A temporary agreement that holds could push oil lower and take some pressure off the inflation outlook. Yet, a breakdown could reverse some of the late-May relief trade in a hurry. Investors will have to price that uncertainty alongside a wall of incoming data this month, including May employment reports, inflation reads, and retail sales, all landing before or on the day of the Fed decision. Layer in the expected debut of SpaceX, likely the largest IPO in history, and the Russell reconstitution at month-end, and the structural demands on the market in June are considerable. Of course, none of these items change the fact that the fundamental backdrop, record earnings, strong AI-driven investment, and a labor market that continues to hold together, remains supportive of current stock prices. But after the kind of run we've had since late March, the market is priced for a lot to go right. And June has enough moving pieces to test this assumption, in our view.
The week ahead:
- May ISM Manufacturing (Monday), April JOLTS (Tuesday), ADP private payrolls (Wednesday), ISM Services (Wednesday), and the May nonfarm payrolls report (Friday) line a busy calendar for economic releases.
- Obviously, the labor data will matter most to investors. Markets have been comfortable with slower growth as long as job conditions remain orderly. Still, a softer payrolls print alongside firmer wage growth could further complicate Federal Reserve policy at a time when a new Fed Chair is taking the helm.
- Late-season earnings reports include Hewlett Packard, Dollar General, Palo Alto Networks, Ulta Beauty, Broadcom, CrowdStrike, Veeva, Ciena, and Lululemon.