Will Warsh use Jackson Hole to start mapping the Fed’s route? And will Nvidia help refill the AI punchbowl this week?
ANTHONY SAGLIMBENE – CHIEF MARKET STRATEGIST, AMERIPRISE FINANCIAL
WEEKLY MARKET PERSPECTIVES — August 24, 2026

U.S. stocks declined last week, snapping a three-week winning streak for the S&P 500 Index, NASDAQ Composite, and Russell 2000 Index as long-end Treasury yields hit fresh multi-decade highs and retail earnings disappointed. This week, July core PCE, the second reading of Q2 GDP, NVIDIA's earnings report, and Fed Chair Kevin Warsh's speech at Jackson Hole will be the key events.
Last week in review:
- The S&P 500 fell 1.4% last week, the NASDAQ dropped 2.0%, the Dow Jones Industrial Average declined 0.8%, and the Russell 2000 slipped 1.6%. Healthcare and Energy outperformed, while Utilities and Industrials lagged.
- Treasury yields rose across the curve, with the 30-year Treasury yield holding near its highest level since 2007. The move came even after the Treasury unexpectedly increased its buyback program for longer-dated securities, sparking a brief rally that faded amid skepticism that the move could offset structural fiscal pressures. The U.S. Dollar Index fell 0.9%. Gold gained +5.2%, and West Texas Intermediate (WTI) crude rose +3.7%.
- The July FOMC meeting minutes were viewed as slightly less hawkish than expected, with officials citing an outlook for inflation to ease later this year. September rate-hike odds held steady near 35%-40%. Elsewhere, August flash PMIs and the Empire Manufacturing Index both beat expectations.
- Retail earnings were mixed. Walmart posted its slowest comparable sales growth in more than six years and provided softer third-quarter guidance. Home Depot beat on positive comparable sales, while Lowe's cut guidance on weak “do-it-yourself” trends. Target raised its full-year outlook, TJX Companies fell on disappointing U.S. results, and Ross Stores posted a bright spot with comparable sales up +10%.
“The combination of soft-but-incomplete disinflation data and a yield curve under increased fiscal pressure at the long end sets up Warsh’s speech on Friday as an early test of how he views tightening financial conditions, particularly amid growing concerns about U.S. debt and deficit spending.”
Anthony Saglimbene - Chief Market Strategist, Ameriprise Financial
Will Warsh use Jackson Hole to start mapping the Fed’s route?
Kevin Warsh will deliver his first Jackson Hole keynote as Fed Chair on Friday morning. July PCE data will be released on Wednesday, and July CPI already showed core inflation at +2.5% year-over-year, the softest annual pace since March 2021, while the headline figure edged down to +3.4% from +3.5%. We believe the combination should give the Federal Reserve room to hold rates steady next month. But the Treasury curve has steepened recently, and Treasury Secretary Scott Bessent has announced larger buybacks in the 10- to 30-year space. Treasury described the move as liquidity support, though markets largely interpreted it as an attempt to relieve pressure on longer-term rates. Whether efforts here will prove a successful strategy remains open to debate. Nevertheless, the combination of soft-but-incomplete disinflation data and a yield curve under increased fiscal pressure at the long end sets up Warsh’s speech on Friday as an early test of how he views tightening financial conditions, particularly amid growing concerns about U.S. debt and deficit spending. And of course, higher defense-related spending tied to the Iran conflict and growing debt issuance for AI infrastructure add to an already complicated financing backdrop.
That said, what investors will likely want most from Warsh’s speech is a clearer picture of the Fed’s reaction function. Warsh has spent his early tenure stripping away an emphasis on forward guidance and dot-plot signaling, urging investors to read incoming data rather than projections. In our view, the approach so far has left the market without a clear read on when the Fed would act and under what circumstances. This approach also leaves a clear divide in the committee beneath him. The July FOMC minutes showed that most participants favored a hold, several pushed for a hike, and many warned that further tightening would be necessary if inflation didn't continue to decline. We believe investors want Warsh to define the key thresholds and datasets that would move him and the committee off hold. Notably, investors want more clarification on whether he's still drawing a hard line on the +2.0% inflation target, as he did in July when he said, "there is no soft inflation target.” Or, is he building tolerance for higher structural inflation, given the AI-driven productivity gains he has called a genuine supply shock? What about higher energy prices in an already elevated inflation environment? Inquisitive minds want to know.
Investors also want to hear about task force updates this week, though we suspect that might carry more weight at the September press conference following the rate decision and economic updates. Warsh's five review groups, covering communications, balance sheet policy, economic data, inflation measurement, and technology/productivity, are due to conclude by year-end, and Jackson Hole is a logical venue to preview direction even without a formal announcement. In addition, investors will likely be looking to parse out potential signals in his speech about the upcoming Summary of Economic Projections. For example, Warsh has been openly skeptical of the dot plot's value. Thus, any hint that the Fed is broadening its employment and inflation lens or adjusting its communications on forecasting would be notable. That said, a full framework revision requires the complete review process, so a formal change this week would be a surprise, and in our view, unlikely.
Bottom line: Friday's speech is highly likely to offer little valuable insight into forward-rate policy. In fact, Warsh appears to be building his credibility on actually rejecting that kind of guidance. The current backdrop, sticky but decelerating inflation against a steepening yield curve, gives him room to remain quiet on forward policy. But whether the Chair likes it or not, investors need greater clarity on some of the rules of the road for governing the Fed’s reaction function under his leadership. This week’s Jackson Hole speech, from our vantage point, is a pretty good place to start mapping the route. We’ll soon see if the Chair views his speech the same way.
And will NVIDIA help refill the AI punchbowl this week?
NVIDIA reports second-quarter results on Wednesday after the market close. Shares are down roughly 2.0% since its May report, while the broader AI narrative has seen several ebbs and flows in direction over that period. However, NVIDIA’s valuation has come in meaningfully during this stretch, with the forward price-to-earnings ratio near 19x, down from a five-year average of roughly 60, according to FactSet. So, the setup for NVIDIA this week carries less risk of a crowded trade unwinding on good news versus prior quarters. And if the company’s report and outlook impresses this week, it might actually raise the odds of a release that finally breaks entrenched patterns post-release.
Bespoke Investment Group recently noted that NVIDIA has delivered 14 earnings “triple plays” over its last 20 earnings reports, meaning a beat on EPS, a beat on revenue, and a guidance raise for the next quarter. Interestingly, the last three reports in a row have all been triple plays. Yet, the stock finished down on the day after each of those three reports. Bespoke highlighted that for most companies, a triple play would be unusual and “reward-worthy”. However, for NVIDIA, such metrics are the expected outcome at this point. Thus, investors have stopped rewarding such profit strength alone. In addition, the Q2 release (what we’ll get this week) has NVIDIA's weakest seasonal track record, averaging roughly a 0.5% one-day decline historically. That said, most of that weakness comes from two extreme down days in 2003 and 2004, back when NVIDIA was a gaming-only chipmaker with no AI or data center exposure. In our view, history becomes less relevant to today's business, but it does mean Q2 has the least favorable seasonal backdrop of NVIDIA's four reporting quarters.
Given that setup, we believe a beat-and-raise report this week likely won't be enough to drive the stock higher on its own. Investors will want to see revenue for the previous quarter meaningfully above the roughly $92 billion Bloomberg consensus, with a Q3 guide indicating meaningful acceleration. Investors will also want an update on the Vera Rubin production ramp, customer adoption, and monetization efforts. And a gross margin near 75% will likely matter less than commentary on whether that level survives the platform transition from Blackwell to Vera Rubin, as well as rising memory costs into next year. Most importantly, investors will be listening to how directly CEO Jensen Huang addresses demand quality on the earnings call, since that's the more subjective piece of the puzzle, in our view.
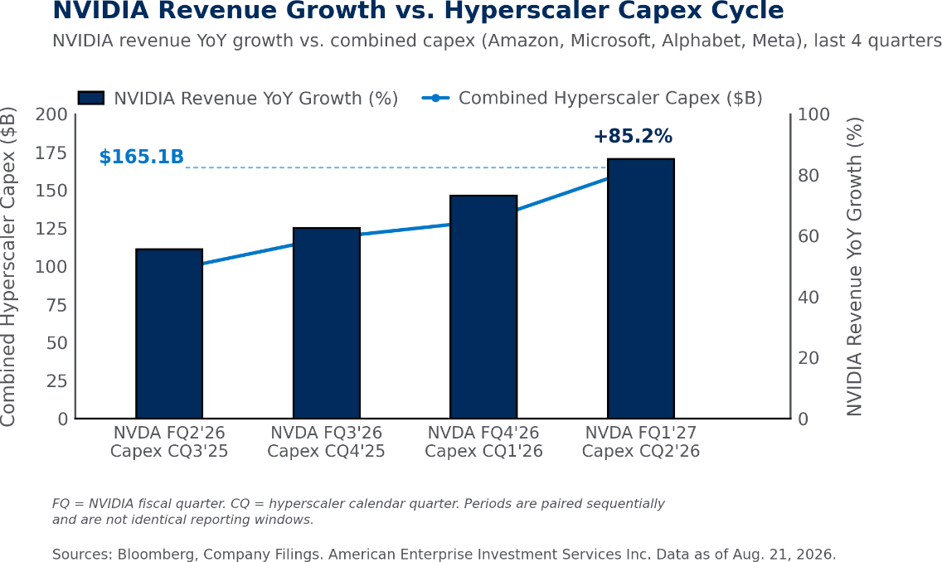
Importantly, that demand quality question ties directly to NVIDIA's expanding role in financing its own AI ecosystem. Over the past several weeks, NVIDIA has committed up to $105 billion in credit support for parts of a data center campus in Ohio leased by OpenAI, joined a coalition of Wall Street firms targeting a $500 billion compute financing platform, deepened a partnership with SK Group worth more than $500 billion in combined business, and taken a minority stake in data center developer Cloverleaf Infrastructure. According to Bloomberg, non-marketable securities, largely strategic stakes in supply chain and ecosystem partners, nearly doubled to $43.4 billion last quarter from $22.3 billion, and total supply commitments reached $145 billion, above the roughly $120 billion level flagged as a watch point the quarter before. Finally, separate arrangements with CoreWeave may leave NVIDIA with contingent exposure if contracted capacity is not absorbed as expected.
Bottom line: How Huang frames NVIDIA’s growing and complex set of circular financing arrangements across the AI ecosystem may become a larger focus on Wednesday's call, and how his framing is received by investors may do more to move the stock post-earnings than the headline numbers and outlook itself. If he ties the financing web explicitly to independently verifiable hyperscaler demand, with a convincing outlook for visible revenue over the coming quarters, the stock might break out of its recent stall and possibly reignite interest in the AI narrative more broadly. But if his comments and framing read as more circular deals without new specifics, we believe investors should expect headwinds for the stock and tech more broadly.
The week ahead:
- July core PCE, July durable goods orders, and the second reading of Q2 GDP are due Wednesday, followed by final August University of Michigan consumer sentiment on Friday.
- Beyond NVIDIA, notable earnings this week include CrowdStrike, Salesforce, and Synopsys on Wednesday, followed by Best Buy, Dollar General, Dollar Tree, Workday, and Marvell Technology on Thursday.
Marvell Technology, Workday, Gap, and Lululemon athletica round out the week's earnings calendar on Thursday.
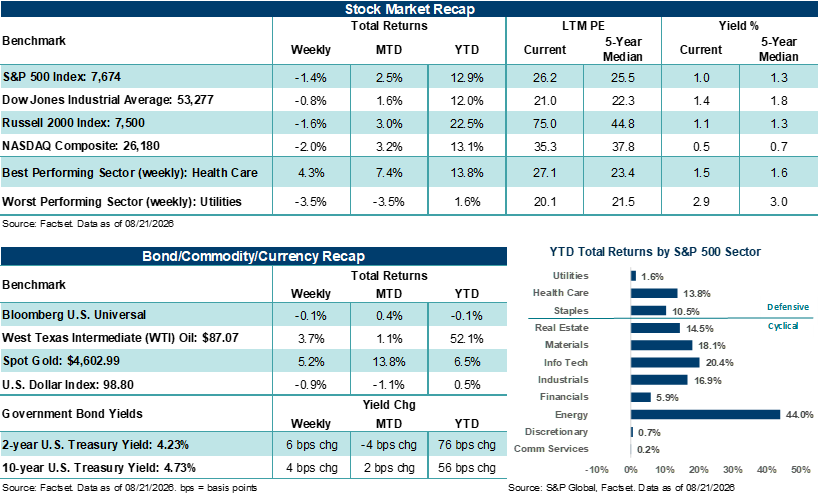
These figures are shown for illustrative purposes only and are not guaranteed. They do not reflect taxes or investment/product fees or expenses, which would reduce the figures shown here. An index is a statistical composite that is not managed. It is not possible to invest directly in an index. Past performance is not a guarantee of future results.
Sources: FactSet and Bloomberg. FactSet and Bloomberg are independent investment research companies that compile and provide financial data and analytics to firms and investment professionals such as Ameriprise Financial and its analysts. They are not affiliated with Ameriprise Financial, Inc.
The views expressed are as of the date given, may change as market or other conditions change, and may differ from views expressed by other Ameriprise Financial associates or affiliates. Actual investments or investment decisions made by Ameriprise Financial and its affiliates, whether for its own account or on behalf of clients, will not necessarily reflect the views expressed. This information is not intended to provide investment advice and does not account for individual investor circumstances.
Some of the opinions, conclusions and forward-looking statements are based on an analysis of information compiled from third-party sources. This information has been obtained from sources believed to be reliable, but accuracy and completeness cannot be guaranteed by Ameriprise Financial. It is given for informational purposes only and is not a solicitation to buy or sell the securities mentioned. The information is not intended to be used as the sole basis for investment decisions, nor should it be construed as advice designed to meet the specific needs of an individual investor.
Alternative investments cover a broad range of strategies and structures designed to be low or non-correlated to traditional equity and fixed-income markets with a long-term expectation of illiquidity. Alternative investments involve substantial risks and may be more volatile than traditional investments, making them more appropriate for investors with an above-average tolerance for risk.
Portfolios that hold a limited number of securities or concentrate investments in similar industries, sectors or geographical regions may experience greater volatility and greater risk of loss as the performance of these investments (either positive or negative) will have a greater impact on the portfolio as a whole.
International investing involves certain risks and volatility due to potential political, economic, social, or currency instabilities and different financial and accounting standards. These risks are enhanced for emerging markets.
Diversification does not assure a profit or protect against loss.
Commodity investments may be affected by the overall market and industry- and commodity-specific factors, and may be more volatile and less liquid than other investments.
There are risks associated with fixed-income investments, including credit (issuer default) risk, interest rate risk, and prepayment and extension risk. In general, bond prices rise when interest rates fall and vice versa. This effect is usually more pronounced for longer term securities.
Stock investments involve risk, including loss of principal. High-quality stocks may be appropriate for some investment strategies. Ensure that your investment objectives, time horizon and risk tolerance are aligned with investing in stocks, as they can lose value.
Investments in small cap companies involve risks and volatility greater than investments in larger, more established companies.
Generally, large-cap companies are more mature and have limited growth potential compared to smaller companies. In addition, large companies may not be able to adapt as easily to changing market conditions, potentially resulting in lower overall performance compared to the broader securities markets during different market cycles
The products of technology companies may be subject to severe competition and rapid obsolescence, and their stocks may be subject to greater price fluctuations.
Past performance is not a guarantee of future results.
An index is a statistical composite that is not managed. It is not possible to invest directly in an index.
Definitions of individual indices and sectors mentioned in this article are available on our website at ameriprise.com/legal/disclosures in the Additional Ameriprise research disclosures section.
The S&P 500 Index is a basket of 500 stocks that are considered to be widely held. The S&P 500 index is weighted by market value (shares outstanding times share price), and its performance is thought to be representative of the stock market as a whole. The S&P 500 index was created in 1957 although it has been extrapolated backwards to several decades earlier for performance comparison purposes. This index provides a broad snapshot of the overall US equity market. Over 70% of all US equity value is tracked by the S&P 500. Inclusion in the index is determined by Standard & Poor’s and is based upon their market size, liquidity, and sector.
The NASDAQ Composite index measures all NASDAQ domestic and international based common type stocks listed on the Nasdaq Stock Market.
The Dow Jones Industrial Average (DJIA) is an index containing stocks of 30 Large-Cap corporations in the United States. The index is owned and maintained by Dow Jones & Company.
The Russell 2000 Index measures the performance of the small-cap segment of the US equity universe. The Russell 2000 is constructed to provide a comprehensive and unbiased small-cap barometer and is completely reconstituted annually to ensure larger stocks do not distort the performance and characteristics of the true small-cap opportunity set. The Russell 2000 includes the largest 2000 securities in the Russell 3000.
The US Dollar Index (USDX) indicates the general international value of the USD. The USDX does this by averaging the exchange rates between the USD and major world currencies. This is computed by using rates supplied by approximately 500 banks.
West Texas Intermediate (WTI) is a grade of crude oil commonly used as a benchmark for oil prices. WTI is a light grade with low density and sulfur content.
University of Michigan Consumer Sentiment Survey is a rotating panel survey based on a nationally representative sample of households in the U.S. that measures how consumers feel about the economy, personal finances, business conditions, and buying conditions.
Flash PMI is an early estimate of the Purchasing Managers’ Index based on partial survey data collected before the month ends. It provides a timely snapshot of economic activity in the manufacturing and/or services sectors.
The Empire Manufacturing Index (also called the Empire State Manufacturing Survey or Empire State Business Conditions Index) is a monthly indicator published by the Federal Reserve Bank of New York that measures business activity in New York State's manufacturing sector. It is based on a survey of manufacturers regarding changes in orders, shipments, employment, inventories, and other business conditions.
Personal consumption expenditures (PCE) is a measure of the outlays or how much consumers are spending.
The Consumer Price Index (CPI) is an inflation indicator that measures the change in the total cost of a fixed basket of products and services, including housing, electricity, food, and transportation. The CPI is published monthly by the Commerce Department and is also commonly referred to as the cost-of-living index.
Third party companies mentioned are not affiliated with Ameriprise Financial, Inc.
Investment products are not insured by the FDIC, NCUA or any federal agency, are not deposits or obligations of, or guaranteed by any financial institution, and involve investment risks including possible loss of principal and fluctuation in value.
Securities offered by Ameriprise Financial Services, LLC. Member FINRA and SIPC.
© 2026 Ameriprise Financial, Inc. All rights reserved.