History suggests oil shocks hurt most when they last
ANTHONY SAGLIMBENE – CHIEF MARKET STRATEGIST, AMERIPRISE FINANCIAL
WEEKLY MARKET PERSPECTIVES — MARCH 16, 2026

The ongoing conflict between Iran and the U.S. and Israel and oil surpassing $100 per barrel last week sent major U.S. stock averages lower for the third straight week. A batch of key economic releases also kept investors busy. This week, the Federal Reserve meets and is widely expected to hold rates steady. However, investors will be most interested in policymakers' updated economic projections and views on inflation, given the recent spike in oil prices.
Last week in review:
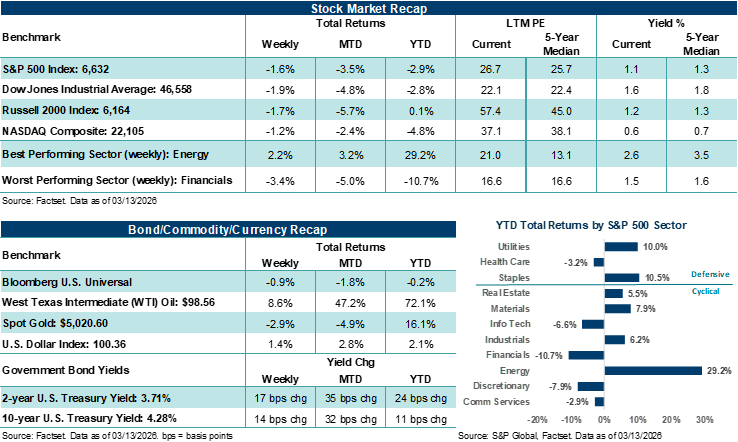
- The S&P 500 Index and NASDAQ Composite fell 1.6% and 1.2%, respectively. The S&P 500 is now off roughly 5.0% from its late January high, while the NASDAQ is off almost 8.0% from its late October high.
- The Dow Jones Industrial Average finished lower by 1.9%, and the Russell 2000 Index ended lower by 1.7%.
- West Texas Intermediate (WTI) crude jumped +8.6% in a volatile week of trading. In response to the effective closure of the Strait of Hormuz, International Energy Agency (IEA) countries, including the U.S., announced they would release 400 million barrels of oil from their reserves to help stabilize supply over time. The U.S. also temporarily lifted sanctions on Russian oil in a very limited scope. But potential U.S. military escorts through the Strait are seen as weeks away from being implemented.
- U.S. Treasury prices were weaker across the curve, the U.S. Dollar Index moved higher, and Gold edged lower.
- Private credit concerns remained in the headlines, with JPMorgan marking down some software-related loans, and others restricting lending or redemptions. And on the trade front, the Trump administration announced dozens of Section 301 investigations into trading partners, focusing on unfair practices, including forced labor.
- Finally, on the economic front, headline and core February CPI were in line with expectations, though seen as stale given the oil price spike. A second look at Q4 GDP was revised lower to +0.7% from +1.8% on adjustments to consumer and government spending, and a preliminary read on March Michigan consumer sentiment showed a decline.
“Unlike oil shocks of the distant past, the U.S. economy is much less oil-intensive today, more energy efficient, and, importantly, an energy exporter to the world. Thus, while energy shocks can be painful for some consumers when oil prices remain elevated, they tend to inflict a smaller proportional hit on the U.S. economy more broadly than in decades past.”
Anthony Saglimbene - Chief Market Strategist, Ameriprise Financial
History suggests oil shocks hurt most when they last
Unfortunately, ongoing conflict in the Middle East contributed to a sharp rise in oil prices last week, with WTI crude finishing at $98.56 per barrel, now up over +47% since the conflict began. Historically, oil price shocks have had measurable effects on U.S. consumer sentiment, the economy, and inflation, though the impacts vary by episode.
Yet, unlike oil shocks of the distant past, the U.S. economy is much less oil-intensive today, more energy efficient, and, importantly, an energy exporter to the world. Thus, while energy shocks can be painful for some consumers when oil prices remain elevated, they tend to inflict a smaller proportional hit on the U.S. economy more broadly than in decades past. But we would be remiss if we didn’t point out that a large portion of consumers today are already feeling pinched by years of higher prices, as core inflation has increased by more than +25% cumulatively over the last six years. Thus, we believe the recent sharp rise in gasoline prices, if lasting, could be seen more negatively by a large group of consumers already feeling stretched.
According to Ameriprise Chief Economist Russell Price, CFA, given the rise in crude and gasoline prices thus far, the overall negative impact on real Gross Domestic Product (GDP) could be about 1.5% to 2.0% on an annualized basis. Importantly, economic growth was set to benefit from higher tax refunds this year, but the extra funds are now likely to be at least partially lost to inflation from higher gas prices.
Below is a summary of how consumers and the economy have reacted to previous oil price shocks, which we believe may be helpful for historical perspective as investors navigate the coming days and weeks.
- 1970s Oil Shocks (Arab Oil Embargo, Iranian Revolution, and Iran/Iraq War): In 1973–74, the Organization of Arab Petroleum Exporting Countries (OAPEC) embargoed the U.S., pushing oil prices from about $3.00 to over $11.50 per barrel by January 1974. The University of Michigan Consumer Sentiment Index fell sharply, and the U.S. entered a recession in November 1973 and exited in March 1975, according to the National Bureau of Economic Research. Headline inflation, as measured by the Consumer Price Index (CPI), rose to over +12.0% in late 1974, and unemployment peaked at 9.0% in May 1975. In 1979–80, political instability in Iran and the onset of the Iran/Iraq War drove a second oil shock, with prices more than doubling between April 1979 and April 1980. Consumer sentiment fell to its lowest level recorded at that time in May 1980, and the U.S. experienced back-to-back recessions in 1980 and again in 1981-1982. Headline CPI reached over +13.0% in 1979, and unemployment rose to nearly 11.0% by November 1982.
- 1990 Gulf War: Iraq’s invasion of Kuwait in August 1990 caused WTI to rise from roughly $17 per barrel in June to $36 by October. That said, the price spike was short-lived, with prices falling into early 1991 as Operation Desert Storm was unfolding. Yet the U.S. did experience a recession from July 1990 to March 1991. As a result, consumer sentiment declined during the second half of 1990 but began to recover the following year. Headline CPI moved from +4.7% year-over-year in June 1990 to +6.4% year-over-year in October 1990, while core CPI remained comparatively steady around the mid +5.0% range.
- 2008 Oil Price Spike: Oil prices rose from approximately $70 per barrel in mid-2007 to a peak of roughly $145 in July 2008. The increase was driven by strong global demand, constrained supply and speculation. Consumer sentiment and spending both fell in the second half of 2008. Headline CPI peaked above +5.0% in July 2008 but fell sharply by year-end as oil prices collapsed during the financial crisis. Core inflation held around the mid +2% range until falling below the threshold by the end of 2008.
- 2011 Arab Spring and Libyan Civil War: Political unrest in the Middle East, particularly in Libya, led to a temporary oil price increase, resulting in Brent crude rising above $110 per barrel in early 2011. Higher gasoline prices in the U.S. contributed to weaker consumer sentiment in the first half of the year, slower Q1 U.S. GDP growth, and a deceleration in consumer spending. Headline CPI rose to +3.6% in May, while core CPI stayed below +2.0%.
- 2022 Russia/Ukraine War: More recently, Russia’s invasion of Ukraine in February 2022 caused Brent oil prices to rise from the mid $80s per barrel to over $120. Here at home, U.S. gasoline prices reached a national average of $5.01 per gallon by June 2022 (a AAA record going back to 2000), while consumer sentiment fell to a record low. Headline CPI rose to +9.1% by June. Notably, even as one-year consumer inflation expectations increased temporarily, five-year expectations remained relatively anchored. Note: Inflation at the time reflected both war-driven energy and food shocks as well as the pandemic-era imbalances.
With that history as background, early in the current conflict between Iran and the U.S./Israel, investors are attempting to discount the ultimate impacts of higher oil prices on consumer sentiment, activity and inflation. At least across past episodes and outside other macro factors, we believe it's the duration of elevated oil prices that largely drives consumer and economic effects. For example, short-lived oil spikes, such as in 2011, were associated with temporary declines in sentiment and limited spillover into core inflation and reduced consumer spending.
In contrast, prolonged periods of high oil prices, as seen in the 1970s and 2008, tend to be associated with deeper and more persistent declines in consumer sentiment, reductions in consumer spending and broader inflationary pressures. Of course, it’s important to note that other macro factors during these periods also influenced economic conditions and policy responses beyond oil prices, complicating these connections. Interestingly, despite repeated oil shocks throughout history, the S&P 500 Index has averaged an annual price return of +8.5% from the end of 1973 to the end of 2025. In our view, this suggests oil shocks should be somewhat discounted by long-term investors as long as larger knock-on effects to growth and corporate profits are avoided.
So, how should investors respond to the current oil shock? And what are the important items to watch right now?
- From an investment perspective, the situation in Iran comes down to when the conflict subsides, Gulf State oil production returns to normal and the Strait of Hormuz reopens. As of right now, the market appears to be pricing conditions that will likely return to a more normal state within a few months. But that expectation is certainly subjective and comes with fingers crossed at present.
- The Federal Reserve meets this week and is widely expected to hold rate policy steady while likely communicating a flexible approach to future policy based on Middle East dynamics. Although updated economic projections could attempt to discount some of the impacts of higher oil prices, investors should include the asterisk “subject to change” next to these projections. Importantly, despite market odds of Fed rate cuts this year falling last week due to potentially higher inflation, we believe policymakers have plenty of room to support the economy should the need arise. That could help reduce some of the potential sting and knock-on effects to growth and employment should oil prices or Middle East tensions drag on longer than expected.
- Finally, stock markets overall have taken Middle East developments in stride, as well as a host of other headline concerns, which is a positive in our view. That said, should oil prices move higher or linger at elevated levels, then we would expect stock volatility to rise and possibly contribute to larger, broader market pressures. However, fundamental conditions in the U.S. remain solid, and the Fed has room to cut rates if needed. This could provide eventual support once markets work through discounting the near-term pain of higher energy costs.
The week ahead:
- The Federal Reserve is very likely to leave its policy rate steady at 3.50%-3.75% on Wednesday. However, investors will be looking to see if policymakers believe higher oil prices will disrupt current inflation and employment trends.
- Housing data, February producer price inflation, NVIDIA’s GTC 2026 event, and retail earnings reports line the week.
These figures are shown for illustrative purposes only and are not guaranteed. They do not reflect taxes or investment/product fees or expenses, which would reduce the figures shown here. An index is a statistical composite that is not managed. It is not possible to invest directly in an index. Past performance is not a guarantee of future results.
Sources: FactSet and Bloomberg. FactSet and Bloomberg are independent investment research companies that compile and provide financial data and analytics to firms and investment professionals such as Ameriprise Financial and its analysts. They are not affiliated with Ameriprise Financial, Inc.
The views expressed are as of the date given, may change as market or other conditions change, and may differ from views expressed by other Ameriprise Financial associates or affiliates. Actual investments or investment decisions made by Ameriprise Financial and its affiliates, whether for its own account or on behalf of clients, will not necessarily reflect the views expressed. This information is not intended to provide investment advice and does not account for individual investor circumstances.
Some of the opinions, conclusions and forward-looking statements are based on an analysis of information compiled from third-party sources. This information has been obtained from sources believed to be reliable, but accuracy and completeness cannot be guaranteed by Ameriprise Financial. It is given for informational purposes only and is not a solicitation to buy or sell the securities mentioned. The information is not intended to be used as the sole basis for investment decisions, nor should it be construed as advice designed to meet the specific needs of an individual investor.
Diversification does not assure a profit or protect against loss.
There are risks associated with fixed-income investments, including credit (issuer default) risk, interest rate risk, and prepayment and extension risk. In general, bond prices rise when interest rates fall and vice versa. This effect is usually more pronounced for longer term securities.
Stock investments involve risk, including loss of principal. High-quality stocks may be appropriate for some investment strategies. Ensure that your investment objectives, time horizon and risk tolerance are aligned with investing in stocks, as they can lose value.
Investments in small cap companies involve risks and volatility greater than investments in larger, more established companies.
Generally, large-cap companies are more mature and have limited growth potential compared to smaller companies. In addition, large companies may not be able to adapt as easily to changing market conditions, potentially resulting in lower overall performance compared to the broader securities markets during different market cycles
The products of technology companies may be subject to severe competition and rapid obsolescence, and their stocks may be subject to greater price fluctuations.
Past performance is not a guarantee of future results.
An index is a statistical composite that is not managed. It is not possible to invest directly in an index.
Definitions of individual indices and sectors mentioned in this article are available on our website at ameriprise.com/legal/disclosures in the Additional Ameriprise research disclosures section.
The S&P 500 Index is a basket of 500 stocks that are considered to be widely held. The S&P 500 index is weighted by market value (shares outstanding times share price), and its performance is thought to be representative of the stock market as a whole. The S&P 500 index was created in 1957 although it has been extrapolated backwards to several decades earlier for performance comparison purposes. This index provides a broad snapshot of the overall US equity market. Over 70% of all US equity value is tracked by the S&P 500. Inclusion in the index is determined by Standard & Poor’s and is based upon their market size, liquidity, and sector.
The NASDAQ Composite index measures all NASDAQ domestic and international based common type stocks listed on the Nasdaq Stock Market.
The Dow Jones Industrial Average (DJIA) is an index containing stocks of 30 Large-Cap corporations in the United States. The index is owned and maintained by Dow Jones & Company.
The Russell 2000 Index measures the performance of the small-cap segment of the US equity universe. The Russell 2000 is constructed to provide a comprehensive and unbiased small-cap barometer and is completely reconstituted annually to ensure larger stocks do not distort the performance and characteristics of the true small-cap opportunity set. The Russell 2000 includes the largest 2000 securities in the Russell 3000.
The US Dollar Index (USDX) indicates the general international value of the USD. The USDX does this by averaging the exchange rates between the USD and major world currencies. This is computed by using rates supplied by approximately 500 banks.
West Texas Intermediate (WTI) is a grade of crude oil commonly used as a benchmark for oil prices. WTI is a light grade with low density and sulfur content.
The Consumer Price Index (CPI) is an inflation indicator that measures the change in the total cost of a fixed basket of products and services, including housing, electricity, food, and transportation. The CPI is published monthly by the Commerce Department and is also commonly referred to as the cost-of-living index.
Headline CPI measures the overall change in prices paid by consumers for a broad basket of goods and services.
Core CPI measures inflation excluding food and energy prices
Third party companies mentioned are not affiliated with Ameriprise Financial, Inc.
Investment products are not insured by the FDIC, NCUA or any federal agency, are not deposits or obligations of, or guaranteed by any financial institution, and involve investment risks including possible loss of principal and fluctuation in value.
Securities offered by Ameriprise Financial Services, LLC. Member FINRA and SIPC.
© 2026 Ameriprise Financial, Inc. All rights reserved.