Ugh, here comes September. But what follows tends to be positive for investors.
ANTHONY SAGLIMBENE – CHIEF MARKET STRATEGIST, AMERIPRISE FINANCIAL
WEEKLY MARKET PERSPECTIVES — August 31, 2026

U.S. stocks were mostly higher last week, with the S&P 500 Index, NASDAQ Composite, and Dow Jones Industrial Average all posting modest gains, while the Russell 2000 Index lagged. This week, August nonfarm payrolls, the ISM manufacturing and services reports, and the Fed's Beige Book will be the key events to watch.
Last week in review:
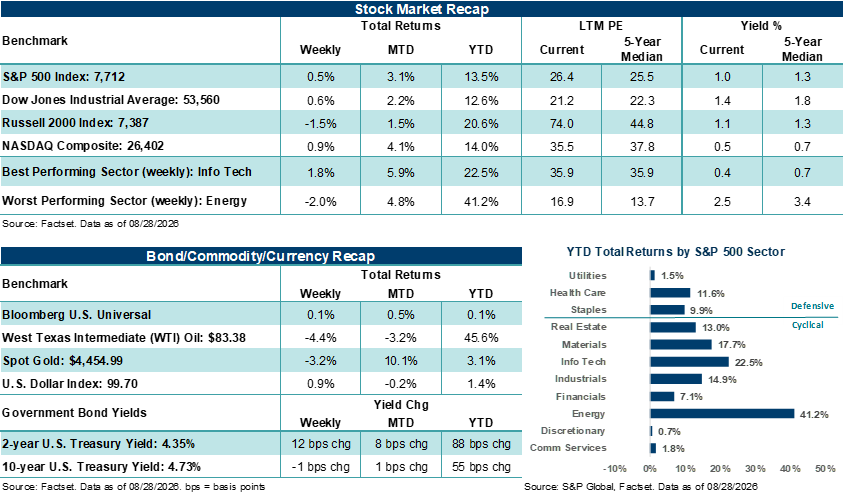
- The S&P 500 Index rose +0.5% last week, the NASDAQ Composite gained +0.9%, and the Dow Jones Industrial Average added +0.6%. The Russell 2000 Index fell 1.5%. Technology and Communication Services led sector performance, while Health Care and Energy lagged.
- NVIDIA delivered better-than-expected quarterly results and guidance, with management pointing to strong data center demand and raising its long-term revenue growth outlook well above consensus. The stock rallied sharply on the report before giving back much of the move as the broader semiconductor and AI trade came under renewed pressure. Other major technology reporters were mixed. CrowdStrike and Salesforce rallied on strong results, while Marvell Technology and HP Inc. declined despite beating estimates, as investors focused on elevated expectations/slower guidance.
- Fed Chair Kevin Warsh's Jackson Hole speech leaned hawkish on inflation. He reaffirmed the Fed's 2.0% Personal Consumption Expenditures (PCE) target and described rates as the primary policy tool to fight inflation, while noting price stability remains "more concerning" despite recent softer data. The speech was viewed as bolstering the Fed's credibility, and market-implied odds of a September rate hike rose to 57% from around 40% the prior week.
- Treasury yields were mixed, with the curve flattening as Warsh's speech pressured the front end. The U.S. Dollar Index rose +0.9%, its best week since June. Gold fell 3.2%, snapping a multi-week winning streak. West Texas Intermediate (WTI) crude fell 4.4% on reports of rising Strait of Hormuz transit volumes.
Trade tensions escalated, with the U.S. imposing 50% tariffs on roughly $20 billion of Canadian goods and Canada retaliating with tariffs of its own on hundreds of U.S. products.
“Seasonal weakness is not a reason to step away from stocks. September's soft patch has historically been a function of timing and fundamental drivers influencing stocks at the time. As we enter this September, we believe the fundamental backdrop for stocks and the economy is sound.”
Anthony Saglimbene - Chief Market Strategist, Ameriprise Financial
Ugh, here comes September. But what follows tends to be positive for investors.
On Tuesday, the calendar will flip to what has historically been one of the most difficult 30-day periods for stocks. September has produced the weakest month of performance for the S&P 500 Index on average, a pattern that has held consistently across nearly a century of data going back to 1928. Notably, the Index has averaged a small monthly loss in September, with roughly a coin-flip chance of finishing the month positive, according to Bloomberg data. In fact, no other month in the calendar has a negative S&P 500 long-run average return, making September a unique outlier versus the rest of the year.
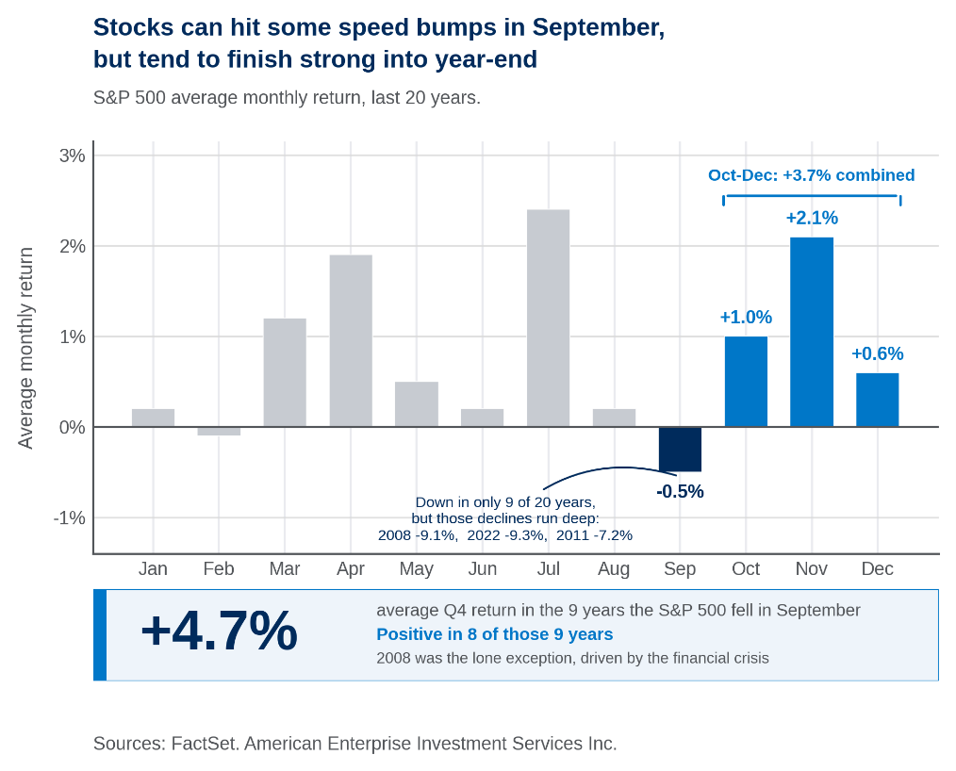
Over the last 20 years, the S&P 500 has averaged a 0.5% decline in September. Yet the Index has risen in September during nine of the last 20 years, suggesting weakness during the month isn’t necessarily chronic. In fact, FactSet data shows that September weakness tends to be occasional, but when it hits, it can lead to sharp declines in stocks.
Case in point, the negative September average over the last 20 years traces to a handful of deep declines (e.g., 2008, 2011, and 2022), rather than a steady monthly bleed. And as is usually the case with such outliers, some event or fundamental driver in the market/economy is usually behind the decline. Thus, we believe such color can help change how an investor reads the month. It’s important to point out that September doesn’t typically drag down returns year after year, even though it gets a bad rap for being the month that produces a negative return on average. Instead, September has historically delivered the calendar's largest single-month drops when other market dynamics are going south, but roughly flat-to-positive outcomes when market and economic conditions are more normal. In our view, that makes September seasonality weakness a risk to be aware of in the context of other market dynamics, but not necessarily a month investors want to consistently avoid stocks.
These figures are shown for illustrative purposes only and are not guaranteed. An index is a statistical composite that is not managed. It is not possible to invest directly in an index. Past performance is not a guarantee of future results.
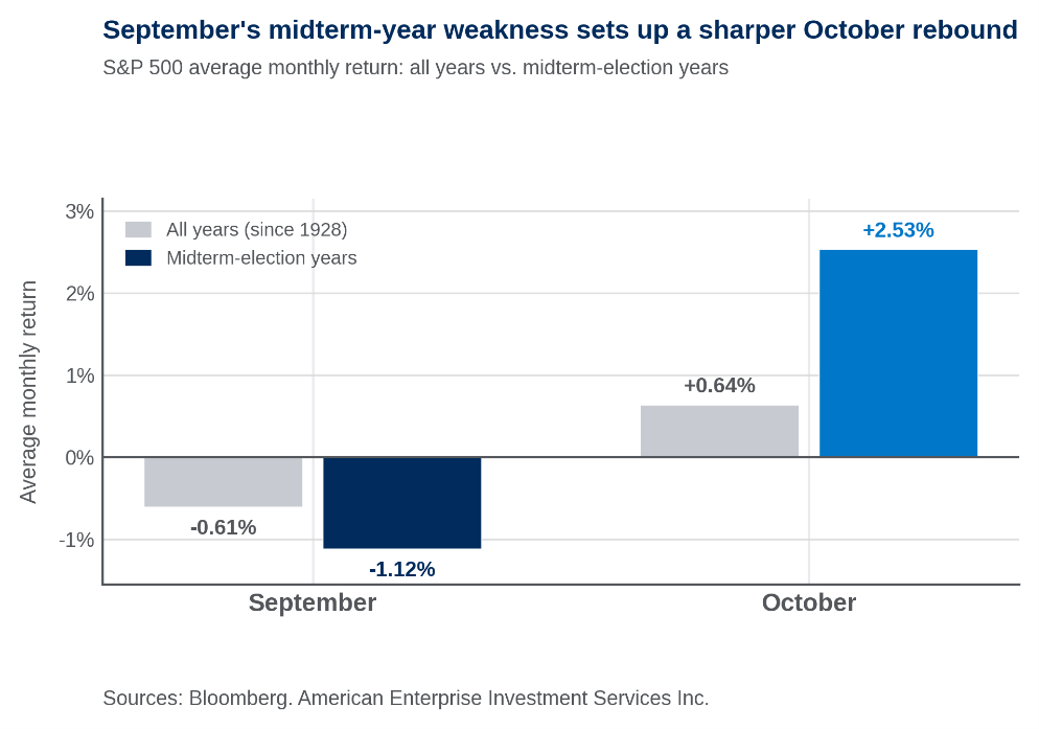
That said, this is a midterm election year, and seasonal factors tend to shift. Historically, midterm years have, on average, produced a softer stretch for stocks in the four-year presidential cycle, even though second-term presidents tend to see better midterm-year performance than first-term presidents. Nevertheless, full-year S&P 500 returns during midterm years have averaged roughly half those of non-midterm years, with a lower share of positive years, according to Bloomberg. And September itself has run weaker in midterm election years than its already-negative norm, as seen in the chart below.
So, stocks tend to be weak in September and can be even weaker during midterm election years. But what about the rest of the year? Here’s where history tends to turn from red to green. For example, the S&P 500 has averaged a +2.5% gain in October during midterm years, well above its all-year average. The Index also tends to bottom in early October, after its more difficult September period, roughly a month before Election Day, according to Bloomberg. And for investors with excess cash to put to work, the soft patch in September and early October has historically marked a favorable entry point rather than an exit point, whether or not it's an election year.
Notably, the weaker early fall period (when it occurs) has historically given way to strength through the rest of the year, in midterm years and otherwise. Over the last 20 years, the S&P 500 has averaged a +3.7% return in October, November, and December, and +4.7% in the nine years when the S&P 500 was negative in September. Over that stretch, the Index has averaged a +2.1% return in November alone, one of the strongest months of the calendar.
That year-end tailwind runs even stronger in midterm years specifically. For example, the fourth quarter of midterm years and the first quarter of the following year rank among some of the strongest segments for the S&P 500 throughout the entire presidential cycle since 1944. Interestingly, the Index has averaged gains of roughly +6.0% and +7.0% in those two quarters, according to Bloomberg.
These figures are shown for illustrative purposes only and are not guaranteed. An index is a statistical composite that is not managed. It is not possible to invest directly in an index. Past performance is not a guarantee of future results.
Of course, this year hasn’t necessarily gone as history might have scripted. The historical election setup assumes summer and early-fall weakness that builds fear and clears positioning before stocks turn higher later in the year. Instead, the S&P 500 reached its year-to-date high in early August, and while the Index has seen periods of weakness throughout the year, it's up +13.5% year-to-date, well ahead of the typical flat performance usually seen at this point in midterm years. Equity volatility has also held near multidecade lows, and investors have been much more focused on other items we routinely discuss in these pages versus the makeup of Congress. In fact, given that most have expected all year that the November election would produce divided government, investors have found it easier to look past the usual election anxiety. We’ll see if that remains the case as we move through September and October.
Bottom line: Importantly, seasonal weakness is not a reason to step away from stocks. September's soft patch has historically been a function of timing and fundamental drivers influencing stocks at the time. As we enter this September, we believe the fundamental backdrop for stocks and the economy is sound. Corporate earnings have continued to grow at impressive rates, and the U.S. economy has continued to expand. As long as those two drivers stay intact, we would look through any potential September/early October volatility rather than react to it. History also argues for staying the course. The seasonal setup from October through year-end and into the following spring ranks among the strongest stretches of the calendar in midterm years and beyond. Simply, we believe investors are better served staying invested through the seasonal chop than trying to time around it.
The week ahead:
- August nonfarm payrolls on Friday headline a busy data week, with July JOLTS, August ADP private payrolls, and August ISM manufacturing and services also on the calendar.
- The Federal Reserve releases its latest Beige Book on Wednesday afternoon, with limited Fedspeak from Barr and Waller ahead of the Fed's blackout period beginning September 5th and before the September 16th rate decision.
- Earnings continue with Broadcom, Palo Alto Networks, Dell Technologies, and Medtronic among the notable reporters.
These figures are shown for illustrative purposes only and are not guaranteed. They do not reflect taxes or investment/product fees or expenses, which would reduce the figures shown here. An index is a statistical composite that is not managed. It is not possible to invest directly in an index. Past performance is not a guarantee of future results.
Important Disclosures
Sources: FactSet and Bloomberg. FactSet and Bloomberg are independent investment research companies that compile and provide financial data and analytics to firms and investment professionals such as Ameriprise Financial and its analysts. They are not affiliated with Ameriprise Financial, Inc.
The views expressed are as of the date given, may change as market or other conditions change, and may differ from views expressed by other Ameriprise Financial associates or affiliates. Actual investments or investment decisions made by Ameriprise Financial and its affiliates, whether for its own account or on behalf of clients, will not necessarily reflect the views expressed. This information is not intended to provide investment advice and does not account for individual investor circumstances.
Some of the opinions, conclusions and forward-looking statements are based on an analysis of information compiled from third-party sources. This information has been obtained from sources believed to be reliable, but accuracy and completeness cannot be guaranteed by Ameriprise Financial. It is given for informational purposes only and is not a solicitation to buy or sell the securities mentioned. The information is not intended to be used as the sole basis for investment decisions, nor should it be construed as advice designed to meet the specific needs of an individual investor.
Commodity investments may be affected by the overall market and industry- and commodity-specific factors, and may be more volatile and less liquid than other investments.
There are risks associated with fixed-income investments, including credit (issuer default) risk, interest rate risk, and prepayment and extension risk. In general, bond prices rise when interest rates fall and vice versa. This effect is usually more pronounced for longer term securities.
Stock investments involve risk, including loss of principal. High-quality stocks may be appropriate for some investment strategies. Ensure that your investment objectives, time horizon and risk tolerance are aligned with investing in stocks, as they can lose value.
The products of technology companies may be subject to severe competition and rapid obsolescence, and their stocks may be subject to greater price fluctuations.
Past performance is not a guarantee of future results.
An index is a statistical composite that is not managed. It is not possible to invest directly in an index.
Definitions of individual indices and sectors mentioned in this article are available on our website at ameriprise.com/legal/disclosures in the Additional Ameriprise research disclosures section.
The S&P 500 Index is a basket of 500 stocks that are considered to be widely held. The S&P 500 index is weighted by market value (shares outstanding times share price), and its performance is thought to be representative of the stock market as a whole. The S&P 500 index was created in 1957 although it has been extrapolated backwards to several decades earlier for performance comparison purposes. This index provides a broad snapshot of the overall US equity market. Over 70% of all US equity value is tracked by the S&P 500. Inclusion in the index is determined by Standard & Poor’s and is based upon their market size, liquidity, and sector.
The S&P 500 Information Technology Index comprises those companies included in the S&P 500 that are classified as members of the Global Industry Classification Standard (GICS) information technology sector.
The NASDAQ Composite index measures all NASDAQ domestic and international based common type stocks listed on the Nasdaq Stock Market.
The Dow Jones Industrial Average (DJIA) is an index containing stocks of 30 Large-Cap corporations in the United States. The index is owned and maintained by Dow Jones & Company.
The Russell 2000 Index measures the performance of the small-cap segment of the US equity universe. The Russell 2000 is constructed to provide a comprehensive and unbiased small-cap barometer and is completely reconstituted annually to ensure larger stocks do not distort the performance and characteristics of the true small-cap opportunity set. The Russell 2000 includes the smallest 2000 securities in the Russell 3000.
West Texas Intermediate (WTI) is a grade of crude oil commonly used as a benchmark for oil prices. WTI is a light grade with low density and sulfur content.
The US Dollar Index (USDX) indicates the general international value of the USD. The USDX does this by averaging the exchange rates between the USD and major world currencies. This is computed by using rates supplied by approximately 500 banks.
Personal consumption expenditures (PCE) are a measure of the outlays or how much consumers are spending. The PCE reading is released monthly by the Bureau of Economic Analysis.
NVIDIA and third party companies mentioned are not affiliated with Ameriprise Financial, Inc.
Investment products are not insured by the FDIC, NCUA or any federal agency, are not deposits or obligations of, or guaranteed by any financial institution, and involve investment risks including possible loss of principal and fluctuation in value.
Securities offered by Ameriprise Financial Services, LLC. Member FINRA and SIPC.