Q1 review and Q2 outlook: Staying focused amid a changing market environment
ANTHONY SAGLIMBENE – CHIEF MARKET STRATEGIST, AMERIPRISE FINANCIAL
WEEKLY MARKET PERSPECTIVES — APRIL 6, 2026

Major U.S. stock averages climbed higher in the holiday-shortened week, snapping five consecutive weeks of losses. The conflict in Iran continued to dominate market sentiment last week, with some investor optimism for a potential off-ramp in the violence helping lift stocks. This week, several economic releases will help investors better gauge how the conflict in the Middle East is shaping activity, inflation and sentiment here at home.
Last week in review:
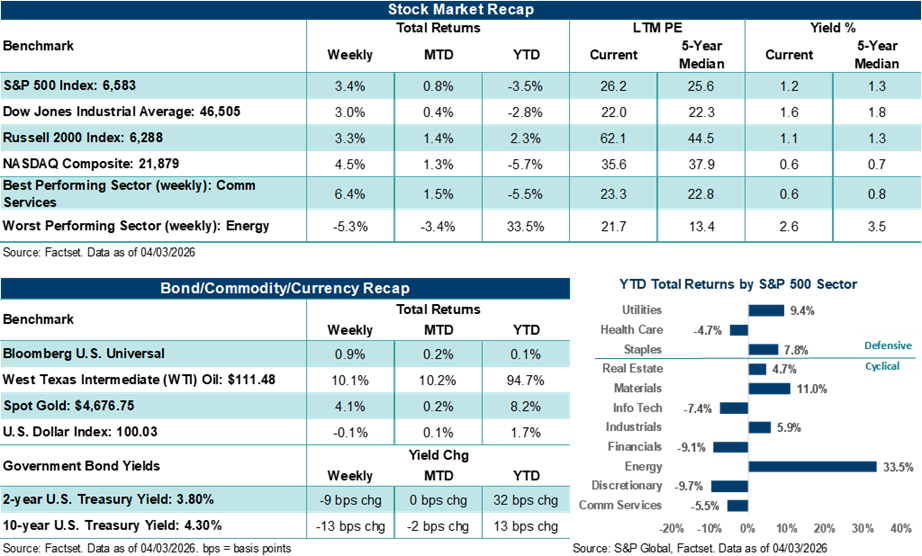
- The S&P 500 Index gained +3.4%, while the NASDAQ Composite climbed +4.5%.
- The Dow Jones Industrial Average rose +3.0%. The Russell 2000 Index gained +3.3%.
- U.S. Treasury yields dipped lower, the U.S. Dollar Index finished marginally lower, Gold moved higher after four straight weeks of losses, and West Texas Intermediate (WTI) crude rose by double-digits and settled at its highest level since mid-2022.
- Headline volatility around the conflict in Iran continued with President Trump addressing the nation on Wednesday to say fighting would continue over the near term. However, his Truth Social posts and media reports noted the U.S. could withdraw from the conflict sooner rather than later.
- On the labor front, March ADP private payrolls topped consensus forecasts, while February job openings came in a bit shy of estimates. March nonfarm payrolls showed a gain of +178,000, well ahead of the 60,000 jobs expected, and the unemployment rate fell to 4.3% from 4.4% in February.
- Finally, February retail sales, March consumer confidence, and March ISM manufacturing all came in ahead of expectations.
“By quarter-end, investors were contending with a materially altered backdrop from expectations entering the new year, marked by higher energy prices, a reset in rate expectations, elevated geopolitical risk and a breakdown in concentrated equity leadership. We believe these forces collectively shaped first-quarter performance across asset classes and may be establishing a more fragile and policy-sensitive environment heading into Q2.”
Anthony Saglimbene - Chief Market Strategist, Ameriprise Financial
Q1 review and Q2 outlook: Staying focused amid a changing market environment.
The first quarter started smoothly, with the S&P 500 Index climbing in January and hitting a new all-time high. However, stocks took a decisive turn lower as the quarter progressed, driven by sector-level dislocations tied to artificial intelligence, evolving monetary policy expectations, and an unexpected oil shock centered in the Middle East. And with stocks entering 2026 at elevated valuations and expectations, momentum quickly faded as the quarter wore on, amid Tech pressure, higher-for-longer rate expectations, uneven U.S. economic data and rising geopolitical risks.
The S&P 500 Index declined 4.3% in Q1, marking only its third negative quarter since 2022, ending a streak of three consecutive quarterly gains. The NASDAQ Composite underperformed materially, falling 7.0% in the first three months of the year, its largest quarterly percentage decline in a year. Notably, the NASDAQ fell into correction territory during the quarter (down 10% or more from a recent high), reflecting its heavy concentration in large-cap technology and software, which experienced significant selling pressure in February and March. In contrast, the Russell 2000 Index eked out a small Q1 gain of +0.9%, and the Equal-Weight S&P 500 Index gained +0.2%, underscoring that weakness was concentrated in the largest capitalization stocks rather than broadly distributed across the market. The Dow Jones Industrial Average lost 3.6% in Q1.
Unfortunately for the major averages, technology leadership fractured meaningfully, with all of the Magnificent Seven stocks declining in the first quarter. For example, Microsoft posted the weakest performance in the group, falling over 23% in Q1, its worst quarterly decline since 2008. Meta Platforms fell by more than 13%, marking its worst quarter since 2022. In addition, Software came under severe selling pressure in Q1, as the iShares Expanded Tech-Software Sector ETF declined by more than 24%. Specifically, investor focus centered on AI-related disruption and displacement risks, as well as heightened competition among large language model developers. Also, growing scrutiny of returns on elevated capital expenditures tied to data centers, computing infrastructure, and AI deployment weighed on Technology and, more broadly, major U.S. stock averages.
Particularly for Tech, the pressure in public markets spilled into private markets as well. Several private credit funds with concentrated software exposure saw elevated redemption requests. In response, some managers restricted withdrawals or limited new lending, while banks marked down select loans tied to the space. Large financial institutions disclosed material exposure but emphasized that the direct risk to the broader financial system was limited. In addition, Federal Reserve officials stated they did not see evidence of contagion. However, the dislocation in private markets highlighted sensitivity to valuation assumptions, leverage and liquidity structures within parts of the nonbank credit ecosystem.
Outside Technology, Energy was the clearest outperformer of the quarter across S&P 500 sectors. Energy gained over +38.0%, Materials rose over +9.0%, Utilities advanced over +8.0% and Consumer Staples rose over +7.5%. Conversely, Financials, Consumer Discretionary, and Information Technology all fell by more than 9.0% in Q1, while Communication Services dropped nearly 7.0% and Healthcare lost nearly 5.0%.
Although Tech and AI disruptions were a dominant factor in driving benchmark direction throughout much of the first quarter, conflict in the Middle East quickly overshadowed the theme in March. On Feb. 28, the United States and Israel launched Operation Epic Fury, a joint military offensive against Iran following failed negotiations over Tehran’s nuclear program. The conflict escalated rapidly, with strikes on Iranian military targets and leadership, followed by retaliatory attacks on U.S. bases, embassies and Gulf State energy infrastructure. Notably, Iran asserted control over the Strait of Hormuz, and drone and missile attacks on commercial vessels led to a near-standstill in shipping across the narrow waterway for all of March.
The conflict quickly removed roughly 20 million barrels per day of crude and refined products from global trade and severely impaired the flow of a wide range of commodities, including liquefied natural gas, fertilizers, aluminum, and helium. Damage to major LNG facilities in Iran and Qatar impacted approximately 17% of global liquefied natural gas capacity. Despite coordinated oil reserve releases across G7 countries, shipping waivers and discussions around naval escorts in the Strait, global oil markets remained strained in March. As a result, WTI crude briefly traded above $119 per barrel and finished Q1 up nearly +77%, its best quarter since Q2’20. As one might expect, these developments drove a sharp risk-off move late in the quarter. Major U.S. equity indices declined sharply in March, with the S&P 500 falling for the third time in four months and the NASDAQ posting its worst monthly performance since March 2025.
Across fixed-income markets, there was a significant repricing of Federal Reserve policy expectations in Q1, given rising inflation concerns. Treasury yields rose over the quarter, with a pronounced flattening of the yield curve. The 2-year yield rose 32 basis points, while the 30-year yield increased just 7 basis points. By late February, futures markets were still pricing more than 50 basis points of additional Fed easing before the end of 2026. By quarter-end, expectations had shifted decisively toward an extended hold, with no rate cuts priced until 2027 and, at points during March, brief pricing of potential rate hikes.
Given the shifting macro and rate backdrop in Q1, the U.S. Dollar Index strengthened, rising over +1.5% for the quarter, its best performance since the fourth quarter of 2024. Gold rose almost +8.0% in Q1, extending its advance to a fifth consecutive quarterly gain, and reached a record settlement price of $5,354.80 per ounce on Jan. 29 before trending lower later in the quarter.
And on the U.S. economic front, the first quarter provided a mixed bag of data. Nonfarm payrolls expanded by +205,000 in Q1, while the unemployment rate ended March at 4.3%. Inflation readings were broadly in line with consensus, though producer prices were hotter than expected and tariff-related effects appeared in several CPI categories. Fourth-quarter GDP was revised down to 0.7% from 1.4%. January and February retail sales were mixed, durable goods orders missed expectations and March flash PMIs pointed to slower growth alongside persistent price pressures. On the plus side, corporate profits continued to come in strong in the final quarter of 2025, while expectations for Q1 and full-year 2026 profits moved higher, indicating that fundamental conditions among U.S. companies remain firm. As a side note, the U.S. Supreme Court in February struck down the Trump administration's use of tariffs under the International Emergency Economic Powers Act. However, the administration immediately extended tariffs under other sections, keeping tariff rates largely unchanged.
That said, by quarter-end, investors were contending with a materially altered backdrop from expectations entering the new year, marked by higher energy prices, a reset in rate expectations, elevated geopolitical risk and a breakdown in concentrated equity leadership. We believe these forces collectively shaped first-quarter performance across asset classes and may be establishing a more fragile and policy-sensitive environment heading into Q2.
Looking ahead, on the constructive side, we believe corporate earnings momentum remains intact, and Q1 profit reports in April and May could provide some foundational support for equities, all else remaining equal. Importantly, corporate profit margins remain strong by historical standards, earnings revisions have accelerated meaningfully in recent months, and valuation multiples have compressed from late-2025 extremes, particularly in Technology and mega-cap stocks. Labor market indicators continue to point to stability rather than outright deterioration, and productivity growth has remained firm, a combination that has historically supported earnings durability even during periods of slower growth. And from an overall market perspective, recent equity declines have pushed investor sentiment sharply lower, leaving several indices oversold, a condition that has often preceded stabilization or recovery once uncertainty peaks.
At the same time, the list of headwinds confronting markets is longer and more immediate than it was at the start of the year. Inflation has reaccelerated, with core PCE moving back above +3.0% and price pressures evident across producer prices and import costs even before accounting for second-round effects from the surge in energy prices. In addition, the Federal Reserve has responded by reinforcing a higher-for-longer policy stance, signaling limited scope for easing rates this year. This shift has pushed short-term yields higher, flattened the curve, and tightened financial conditions. Compounding these pressures is the escalation of the conflict with Iran and the disruption of shipping through the Strait of Hormuz, which has introduced a sustained energy shock, lifting oil prices sharply and increasing uncertainty around inflation expectations, global trade flows, and end demand. In total, these pressures could weigh on growth, demand and profits if sustained for a long enough period.
Against this backdrop, equity leadership has narrowed, technical trends have deteriorated, and we believe markets appear increasingly sensitive to policy signals and geopolitical frictions. In our view, investors should expect continued market volatility, ensure they are comfortable with what they own and how their portfolio is allocated, and reach out to their Ameriprise financial advisor with questions and concerns. Uncertainty is uncomfortable, and market declines can often challenge investors’ confidence. However, history often shows that well-established investment strategies and a longer-term approach are generally a solid way to navigate challenging market periods, such as the one we are currently in.
The week ahead:
- March ISM Services (Monday), February PCE (Thursday), and March CPI (Friday) should provide key updates on activity and inflation trends in the U.S. that will likely be helpful in monitoring Federal Reserve thinking amid the current oil shock.
- A preliminary look at the April University of Michigan consumer sentiment report (Friday) will also be helpful in gauging how consumers are reacting to higher oil/gasoline prices as well as their expectations for inflation over the next 12 months.
- A final read on Q4 GDP (Thursday), and the minutes from the March FOMC meeting (Wednesday) will likely also receive some modest investor attention this week.