Record levels of leverage meet record levels of stock concentration. Points to consider.
ANTHONY SAGLIMBENE – CHIEF MARKET STRATEGIST, AMERIPRISE FINANCIAL
WEEKLY MARKET PERSPECTIVES — July 27, 2026

U.S. stocks fell again last week, with the S&P 500 Index and the NASDAQ Composite extending the prior week's pullback amid mixed Magnificent Seven earnings and higher Treasury yields, which weighed on sentiment. This week, a heavy slate of Big Tech earnings and the July Federal Open Market Committee (FOMC) meeting could set the tone for how markets trade over the rest of the summer.
Last week in review:
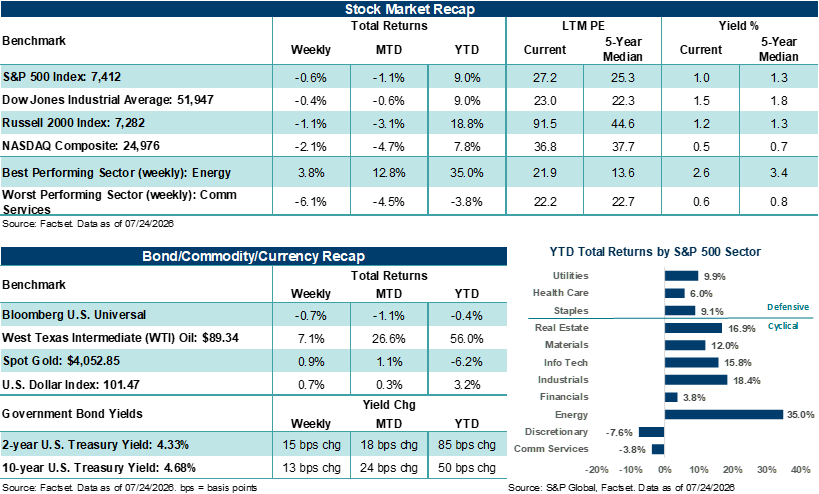
- The S&P 500 fell 0.6%, the NASDAQ dropped 2.1%, the Dow Jones Industrial Average slipped 0.4%, and the Russell 2000 Index declined 1.1%. Tesla, SpaceX, and Alphabet were the biggest mega-cap drags, while Energy, Utilities, and Industrials outperformed.
- Treasury prices weakened with the curve flattening. The 10-year Treasury yield crossed above 4.70% for the first time since early 2025. The U.S. Dollar Index rose +0.7%. Gold gained +1.3%, while West Texas Intermediate (WTI) crude jumped +7.1% on the latest escalation in the U.S./Iran conflict.
- Early Mag Seven reports set a cautious tone. Alphabet fell 7.8% despite strong Cloud growth, pressured by another capital spending guidance raise and negative free cash flow. Tesla dropped 17.8% on weaker auto margins and higher spending. Intel bucked the trend, gaining on data center strength and improving 18A yields. Notably, broader profit results remained constructive, with roughly 85% of reporters beating earnings estimates, though strong prints often drew muted or negative stock reactions given elevated expectations.
- July flash PMIs showed softer manufacturing but stronger services, with employment rebounding and input and selling price inflation accelerating. Initial jobless claims fell to their lowest level since 1969, and June new home sales beat expectations.
- Geopolitical risk stayed elevated. Iran rejected President Trump's ceasefire proposal, and the Red Sea emerged as another potential oil chokepoint after Houthi attacks on Saudi oil tankers.
“Leverage stacked on top of a concentrated market environment can create unique vulnerabilities that we believe investors should at least be cognizant of as we move through the second half.”
Anthony Saglimbene - Chief Market Strategist, Ameriprise Financial
Record levels of leverage meet record levels of stock concentration. Points to consider.
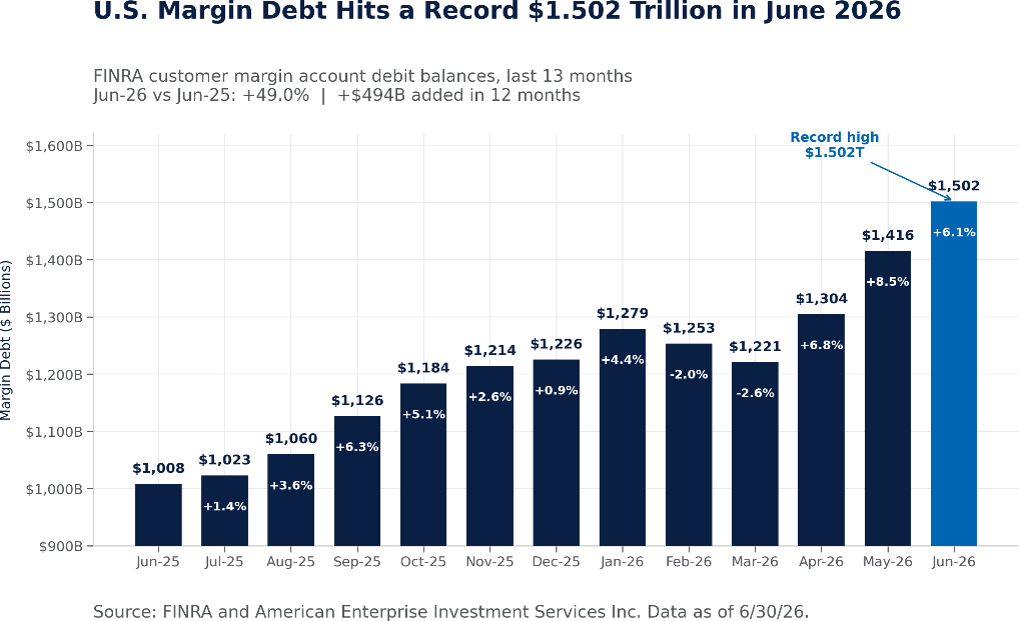
In past commentaries, we’ve made brief reference to the leverage that appears to be building across U.S. equity markets at present. But the June FINRA data below, for example, is making the dynamic more difficult not to address outright. Customer margin debt reached $1.5 trillion, up +49% year-over-year, with $494 billion added just over the last twelve months.
The current reading places margin debt in an unusual historical group. According to FINRA data, only three periods since 1997 have experienced sustained year-over-year growth exceeding 40%: late 1999–2000, mid-2007, and 2021. Each of these periods was eventually followed by a margin debt drawdown of at least 35% and an equity market correction. In late March, CGS International pointed out that the ratio of margin debt to the M2 money supply had reached levels comparable to those in 2008 and was approaching the dot-com peak. Today, that level has been surpassed.
Importantly, FINRA data captures only debit balances at regulated broker-dealers. Less transparent channels of leverage sit outside its lens. In our view, two other forms of leverage use today are worth calling out. Leveraged ETF assets peaked at roughly $207 billion at the end of June before falling to about $168 billion by mid-July, per Bloomberg. And daily rebalancing flows from these products reached a record $50 billion per session at the peak, roughly quadruple the pace at the start of the year. We believe flows in these types of products are adding a structural driver of intraday volatility. For context, nearly 900 leveraged products now trade in the U.S., according to Morningstar. More than 400 of them are tied to single stock ETFs.
And leverage isn’t just a retail story. According to Goldman Sachs, hedge funds increased their net tilt toward Information Technology by 853 basis points during the first quarter, the largest quarterly increase on record, while reducing exposure across most other sectors. More recently, Goldman reported that hedge funds have been net sellers of U.S. technology stocks in six of the last eight weeks. In our view, these shifts highlight how concentrated market exposure to the AI theme has become. When large amounts of capital, leveraged or otherwise, are directed toward the same handful of companies, repositioning activity can amplify market moves well beyond what changing fundamentals alone might justify.
When AI-linked equities and semiconductors sold off earlier this month, forced selling from leveraged products drove the KOSPI sharply lower, triggering circuit breakers nearly daily, a frequency last seen in 2008. Individual leveraged products were so severely dislocated that some fell by double-digit percentages on days when the underlying security rose. And when Korean brokers recently signaled that the margin unwind was nearing exhaustion, the same mechanics amplified the rebound in reverse.
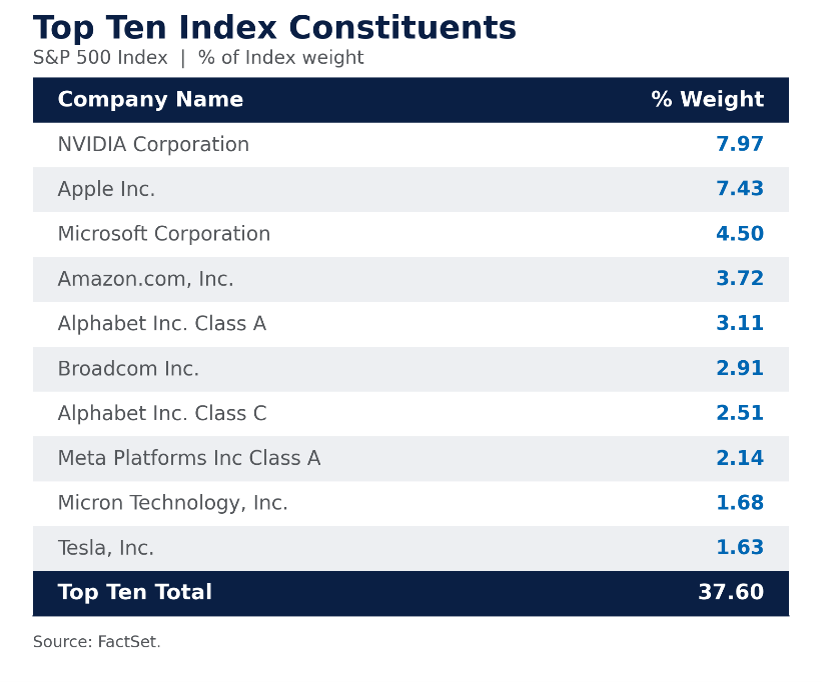
Here at home, the top ten stocks now account for over 37% of the S&P 500 by market capitalization, well above levels seen during the dot-com peak. The Information Technology sector alone represents nearly 38% of the Index, an all-time high for a single sector, while Communication Services (home to Alphabet and Meta Platforms) adds an additional 12%. Notably, the Mag Seven (often a key barometer of Big Tech) as a group has gone nowhere year to date, both in absolute terms and relative to hundreds of other S&P 500 stocks. Thus, AI leadership has broadened this year, but concentration risk and leverage across the Index has not.
Leverage stacked on top of a concentrated market environment can create unique vulnerabilities that we believe investors should at least be cognizant of as we move through the second half. For example, a 5% move up or down in a mega-cap tech stock is going to move the Index far more than a 10-15% move in a smaller-sized stock, even if that stock is among the top 100 largest S&P 500 companies. And when leveraged participants all hold the same names, a factor that is growing, stress up or down can produce larger market swings that may seem out of step with headline developments. So, given that we stand in a highly concentrated, increasingly leveraged market environment today, what can investors do to navigate these dynamics?
First, consider using margin in brokerage accounts sparingly, in concert with your financial advisor's guidance. In our view, most investors should avoid leveraged products in personal portfolios. Such leveraged ETFs are designed for daily trading, not for holding in an account for more than one day. Compounding decay can erode returns quickly, even when a directional view proves correct.
Second, investors should recognize that large price moves in concentrated names may reflect more than just changing fundamentals. When large mechanical rebalancing, due to, say, leveraged ETFs, hits the same handful of stocks every day, intraday trading action may reflect leverage dynamics as much, if not more, than the market’s reaction to specific company developments.
Third, maintain diversification even when owning highly concentrated indexes or themes is winning, and when areas such as non-tech cyclicals or defensives are lagging. Current levels of market leverage may amplify this contrast over the intermediate term, and should the AI theme continue to lead markets higher. That said, while professional money managers take on the risk of underperformance for diversification in highly concentrated markets and when benchmarked to the S&P 500, for example, individual investors should worry much less about this risk. We believe broader portfolio exposure beyond the top 10 S&P 500 stocks is the cleanest hedge against the leverage/concentration risk that has built in today’s market environment. As we have mentioned in previous commentaries, rebalancing to strategic or tactical target weights on a set schedule (e.g., based on time or target weights) can also help remove emotion from the decision.
Bottom line: We believe leverage is becoming a growing risk factor in U.S. equity markets. The combination of record index concentration and record leverage is historically unusual and could be self-reinforcing in both directions. On the way up, leverage in concentrated names can drive performance, attracting more capital and more leverage into those same names. On the way down, forced selling in the most concentrated names hits the Index hardest, triggering more margin calls and more forced selling. The loop runs in both directions, and the mechanics don’t always properly reflect the degree of change in fundamental catalysts. Importantly, we believe investing with intention and discipline during these periods can actually create opportunities for investors with a long enough time horizon.
All this said, we believe the fundamental case for AI-driven earnings growth remains durable and visible, including from some of the most highly concentrated, most leveraged names in the S&P 500 today. However, it is growing more critical to understand concentration levels across major indexes and the leverage to the AI theme now pulsing through the market. Thus, we believe investors should take an eyes-wide-open approach to their portfolio. This includes seeking to fully understand what one owns, and why, and working with an advisor on proactive strategies and tactics to help guard against or take advantage of potentially larger market dislocations that may develop should leverage and concentration risks grow.
The week ahead:
- The July FOMC decision on Wednesday is the main event, with markets pricing a roughly 35% chance of a rate hike.
- 35% of the S&P 500 reports earnings results this week, with Mag Seven dominating the calendar. Meta Platforms and Microsoft report on Wednesday, and Amazon and Apple on Thursday.
Q2 GDP, June PCE, and a broad slate of industrial, consumer, and financial reporters round out a very busy week.
These figures are shown for illustrative purposes only and are not guaranteed. They do not reflect taxes or investment/product fees or expenses, which would reduce the figures shown here. An index is a statistical composite that is not managed. It is not possible to invest directly in an index. Past performance is not a guarantee of future results.
Sources: FactSet and Bloomberg. FactSet and Bloomberg are independent investment research companies that compile and provide financial data and analytics to firms and investment professionals such as Ameriprise Financial and its analysts. They are not affiliated with Ameriprise Financial, Inc.
The views expressed are as of the date given, may change as market or other conditions change, and may differ from views expressed by other Ameriprise Financial associates or affiliates. Actual investments or investment decisions made by Ameriprise Financial and its affiliates, whether for its own account or on behalf of clients, will not necessarily reflect the views expressed. This information is not intended to provide investment advice and does not account for individual investor circumstances.
Some of the opinions, conclusions and forward-looking statements are based on an analysis of information compiled from third-party sources. This information has been obtained from sources believed to be reliable, but accuracy and completeness cannot be guaranteed by Ameriprise Financial. It is given for informational purposes only and is not a solicitation to buy or sell the securities mentioned. The information is not intended to be used as the sole basis for investment decisions, nor should it be construed as advice designed to meet the specific needs of an individual investor.
Alternative investments cover a broad range of strategies and structures designed to be low or non-correlated to traditional equity and fixed-income markets with a long-term expectation of illiquidity. Alternative investments involve substantial risks and may be more volatile than traditional investments, making them more appropriate for investors with an above-average tolerance for risk.
Portfolios that hold a limited number of securities or concentrate investments in similar industries, sectors or geographical regions may experience greater volatility and greater risk of loss as the performance of these investments (either positive or negative) will have a greater impact on the portfolio as a whole.
International investing involves certain risks and volatility due to potential political, economic, social, or currency instabilities and different financial and accounting standards. These risks are enhanced for emerging markets.
Diversification does not assure a profit or protect against loss.
Commodity investments may be affected by the overall market and industry- and commodity-specific factors, and may be more volatile and less liquid than other investments.
There are risks associated with fixed-income investments, including credit (issuer default) risk, interest rate risk, and prepayment and extension risk. In general, bond prices rise when interest rates fall and vice versa. This effect is usually more pronounced for longer term securities.
Stock investments involve risk, including loss of principal. High-quality stocks may be appropriate for some investment strategies. Ensure that your investment objectives, time horizon and risk tolerance are aligned with investing in stocks, as they can lose value.
Investments in small cap companies involve risks and volatility greater than investments in larger, more established companies.
Generally, large-cap companies are more mature and have limited growth potential compared to smaller companies. In addition, large companies may not be able to adapt as easily to changing market conditions, potentially resulting in lower overall performance compared to the broader securities markets during different market cycles
The products of technology companies may be subject to severe competition and rapid obsolescence, and their stocks may be subject to greater price fluctuations.
Past performance is not a guarantee of future results.
An index is a statistical composite that is not managed. It is not possible to invest directly in an index.
Definitions of individual indices and sectors mentioned in this article are available on our website at ameriprise.com/legal/disclosures in the Additional Ameriprise research disclosures section.
The S&P 500 Index is a basket of 500 stocks that are considered to be widely held. The S&P 500 index is weighted by market value (shares outstanding times share price), and its performance is thought to be representative of the stock market as a whole. The S&P 500 index was created in 1957 although it has been extrapolated backwards to several decades earlier for performance comparison purposes. This index provides a broad snapshot of the overall US equity market. Over 70% of all US equity value is tracked by the S&P 500. Inclusion in the index is determined by Standard & Poor’s and is based upon their market size, liquidity, and sector.
The NASDAQ Composite index measures all NASDAQ domestic and international based common type stocks listed on the Nasdaq Stock Market.
The Dow Jones Industrial Average (DJIA) is an index containing stocks of 30 Large-Cap corporations in the United States. The index is owned and maintained by Dow Jones & Company.
The Russell 2000 Index measures the performance of the small-cap segment of the US equity universe. The Russell 2000 is constructed to provide a comprehensive and unbiased small-cap barometer and is completely reconstituted annually to ensure larger stocks do not distort the performance and characteristics of the true small-cap opportunity set. The Russell 2000 includes the largest 2000 securities in the Russell 3000.
The US Dollar Index (USDX) indicates the general international value of the USD. The USDX does this by averaging the exchange rates between the USD and major world currencies. This is computed by using rates supplied by approximately 500 banks.
West Texas Intermediate (WTI) is a grade of crude oil commonly used as a benchmark for oil prices. WTI is a light grade with low density and sulfur content.
The Philadelphia Semiconductor Index (SOX) is a stock market index that tracks the performance of companies in the semiconductor (chip) industry.
A capitalization-weighted index assigns each company a weight based on its total market value (market capitalization). Companies with larger market capitalizations have a greater influence on the index's performance than smaller companies.
An equal-weighted index assigns the same weight to every company in the index, regardless of its market capitalization.
Bank of America's Fund Manager Survey is a monthly poll of professional investors that shows how they feel about the economy and financial markets, including what they see as the biggest opportunities and risks.
Third party companies mentioned are not affiliated with Ameriprise Financial, Inc.
Investment products are not insured by the FDIC, NCUA or any federal agency, are not deposits or obligations of, or guaranteed by any financial institution, and involve investment risks including possible loss of principal and fluctuation in value.
Securities offered by Ameriprise Financial Services, LLC. Member FINRA and SIPC.
© 2026 Ameriprise Financial, Inc. All rights reserved.