Stocks are back at record highs. The AI bull gets another shot in the arm
ANTHONY SAGLIMBENE – CHIEF MARKET STRATEGIST, AMERIPRISE FINANCIAL
WEEKLY MARKET PERSPECTIVES — APRIL 20, 2026

U.S. stocks climbed for a third consecutive week, with the S&P 500 Index notching its first record close since late January. The NASDAQ Composite logged a 13-session winning streak, and Iran ceasefire momentum drove oil prices sharply lower. This week, Kevin Warsh's Fed Chair nomination hearing, a busy Q1 earnings calendar, and key economic releases, including retail sales and flash April PMIs, will be in focus.
Last week in review:
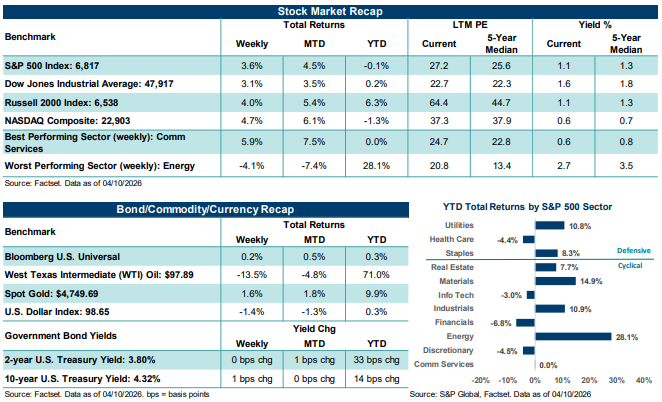
- The S&P 500 gained +4.5% and closed at a fresh all-time high. The NASDAQ climbed +6.8%, extending its winning streak to 13 consecutive sessions, tying it for the fifth-longest in the Index's history. The Dow Jones Industrial Average and Russell 2000 Index also advanced, with all four major averages posting record closes by week's end.
- Technology led all S&P 500 sectors for the week, gaining over +8.1%. Consumer Discretionary and Communication Services also outperformed. Energy was the clear laggard, falling by more than 3.5%.
- U.S. Treasury yields dipped modestly. The U.S. Dollar Index declined 0.6%. Gold moved higher. And West Texas Intermediate (WTI) crude fell sharply, settling at $84.22 per barrel, its largest weekly decline in weeks, as ceasefire optimism eased near-term energy supply fears.
- Progress in the conflict between the U.S. and Iran was the primary driver of last week's gains. Both sides signaled openness to talks following a naval blockade of Iranian ports, Iran confirmed the Strait of Hormuz remained open, and negotiations over Iran's enriched uranium stockpile were advancing. However, over the weekend, Iran said the Strait was once again closed.
- Mechanical buying amplified last week’s move. Goldman Sachs estimated that trading strategies purchased $86 billion in global equities last week, a top-five record pace, with additional buying potentially on tap.
- Bank earnings provided a constructive read on the U.S. consumer. JPMorgan, Bank of America, and Citigroup reported firm card spending, stable labor conditions, and downplayed private credit risks. Per FactSet, S&P 500 EPS growth is now expected at +13.2% year-over-year in Q1, on pace for a sixth straight quarter of double-digit growth.
- March core PPI rose just +0.1%, well below the +0.5% consensus. The Philadelphia Fed and Empire State indexes both beat expectations, and initial jobless claims held steady.
“The S&P 500 and NASDAQ have posted one of the fastest recoveries from a significant drawdown in modern market history. Notably, the AI bull market has been reconfirmed with recent stock gains, and the economic and profit backdrop remains supportive of equities, in our view. Nevertheless, near-term caution is warranted given the market’s narrow breadth, light volume and unresolved risks stemming from the conflict in Iran.”
Anthony Saglimbene - Chief Market Strategist, Ameriprise Financial
Stocks are back at record highs. The AI Bull gets another shot in the arm.
Roughly three weeks ago, the S&P 500 Index was sitting more than 9% below its January peak, the NASDAQ Composite was trading well into correction territory, and investor sentiment was near its most pessimistic level in nearly a year. But that was three weeks ago, which can feel like a lifetime in this headline-driven market environment. So, in case you haven’t been glued to markets, both indexes hit fresh new all-time highs last week, likely stunning the more bearish investors who have had a laundry list of concerns to rattle off since the start of the year. At present, a fragile but holding ceasefire between the U.S. and Iran, now in its third week, has progressively unwound the geopolitical risk premium that drove the late-March selloff across stocks. As the probability of a more durable peace agreement has risen, so too has investors’ appetite for risk assets, like stocks.
In our view, the stock market has decided the Iran conflict is likely to end sooner rather than later, at least for the moment. Falling oil prices, cooler-than-expected March inflation data, a resilient labor market, and a positive start to the Q1 earnings season have quickly reinforced a bullish tone in the market. For example, the latest weekly look at initial jobless claims came in well below the consensus estimate, while March core producer inflation posted its largest downside miss in recent months. In addition, regional manufacturing surveys also surprised to the upside last week, with the April Philadelphia Fed index hitting its highest reading since January 2025. And the April Empire State Index hit its best level in five months.
On Wednesday, the S&P 500 Index closed above 7,000, its first all-time high since January 27 and the first close in the index's history above 7,000. The NASDAQ also closed at a record during the same session (surpassing its October high for the first time) and extended its winning streak to 13 consecutive sessions, its longest since 1992. According to Bespoke Investment Group, since 1928, this is the first time the S&P 500 has returned to all-time highs in eleven trading days or fewer after declining by 5% to 10%. Notably, the pace and strength of the current rebound are faster than the recoveries following both the COVID-19 crash in 2020 and the tariff-driven selloff in April 2025. Going back to 1953, there have been only 44 prior instances of the S&P 500 moving from deeply oversold territory, defined as more than three standard deviations below its 50-day moving average, back to overbought conditions in under three months. At 18 calendar days, this rebound ranked as the seventh-fastest of the 44 occurrences, per Bespoke.
Importantly, last week’s strong gains also reconfirmed the AI Bull market, which began on October 12, 2022. As of April 17, it is 1,283 calendar days old, making it the tenth-longest bull market in S&P 500 history. For perspective, the longest bull market in S&P 500 history ran 4,494 calendar days, from December 1987 to March 2000. Interestingly, the Magnificent Seven (i.e., Apple, Amazon, Alphabet, Meta Platforms, Microsoft, NVIDIA, and Tesla) have risen nearly +20.0% from the March 30 low, compared to roughly +12.3% for the S&P 500. We believe renewed focus on the AI space has been a clear driver of the recent lift in stocks, with compute deals, hyperscaler capital expenditure commitments, and early semiconductor earnings reinforcing confidence in the theme's structural growth durability ahead of key Mag Seven earnings. For example, Taiwan Semiconductor Manufacturing Company reported Q1 net income up +58.0% year-over-year last week, raised its full-year 2026 revenue growth outlook to above +30.0%, and described AI demand as "extremely robust”. Also, the company noted a structural shift from generative to agentic AI, which is lifting chip orders and should play well for NVIDIA’s earnings and outlook report next month. And software and private credit, two areas of significant market scrutiny and stress in recent months, have also posted meaningful recoveries since the March lows.
However, market breadth remains narrow. As of last Thursday, Bespoke data showed that only about half of S&P 500 components were trading above their 50-day moving averages, and only about one in five were in overbought territory. In January, when the S&P 500 last set an all-time high, nearly two-thirds of components were above their 50-day moving averages. At the same time, trading volume last week was light by historical standards, suggesting the recent move higher in stock prices has been driven, at least in part, by short covering and forced positioning adjustments rather than by fresh capital entering the market, per Bloomberg. That said, history shows longer-term returns following recoveries of this speed have generally been positive over the next six-month and one-year time frames. On the sentiment side and likely adding fuel to the current stock recovery, is Bank of America’s latest Global Fund Manager Survey, conducted April 3-9, which showed that 75% of responses came before the April 8 ceasefire announcement and that sentiment was at its most bearish level in ten months. Growth expectations among professional money managers showed their sharpest monthly decline since March 2022, yet 70% of managers still viewed a recession as unlikely, 52% maintained a soft landing as their base case, and 58% still expected Federal Reserve rate cuts this year. The survey's bearish readings largely reflect conditions at the peak of war-fear, prior to the ceasefire, which implies there was ample room for sentiment to improve sharply last week, and that there was likely dry powder on hand to help fuel a stock rally. Nevertheless, after such a powerful rally and a likely more positive-to-neutral reset among professional investors last week, we suspect that the fundamental justification for current stock prices could start to carry more weight in setting the overall market tone.
Lastly, an important factor fueling the recent rally has been the positive messages from America’s largest banks. Q1 results last week from the big banks offered a broadly constructive view of the U.S. economy. Consumer spending remained healthy, credit quality held firm, and trading revenues benefited from elevated market activity in the January-March period. JPMorgan's Jamie Dimon described the U.S. economy as holding up, while Bank of America's Brian Moynihan said consumers are spending and credit quality is "very good and improving.” However, areas of caution remained among the banks, including prolonged geopolitical instability, with Dimon flagging an "increasingly complex" macro environment and several banks noting that uncertainty could weigh on merger and acquisition sentiment and business investment decisions in the quarters ahead.
Bottom line: The S&P 500 and NASDAQ have posted one of the fastest recoveries from a significant drawdown in modern market history. Notably, the AI bull market has been reconfirmed with recent stock gains, and the economic and profit backdrop remains supportive of equities, in our view. Nevertheless, near-term caution is warranted given the market’s narrow breadth, light volume and unresolved risks stemming from the conflict in Iran. Whether this advance can broaden and sustain itself over the coming weeks and months will largely depend on whether the Strait of Hormuz remains open without interruption and whether fundamental conditions in the U.S. continue to support corporate profit growth this year.
The week ahead:
- 93 S&P 500 companies will report Q1 results this week, including Tesla, on Wednesday.
- March retail sales hit on Tuesday, and a first look at April S&P Global manufacturing and services activity hit on Thursday.