Where are stocks headed through year-end?
ANTHONY SAGLIMBENE – CHIEF MARKET STRATEGIST, AMERIPRISE FINANCIAL
WEEKLY MARKET PERSPECTIVES — September 21, 2026

U.S. stocks were mixed last week, with the NASDAQ Composite posting a modest gain while the S&P 500 Index finished lower as the Federal Reserve raised rates and long-end Treasury yields pushed toward 5.0%. This week, flash September PMIs and President Trump's meeting with China's Xi headline the calendar.
Last week in review:
- The S&P 500 Index fell 0.1% last week, the Dow Jones Industrial Average dropped 1.6%, and the Russell 2000 Index declined 1.5%. The NASDAQ Composite rose +0.7%. Healthcare, Communication Services, and Technology outperformed, while Utilities, Financials, and Real Estate lagged.
- The Federal Open Market Committee raised its policy rate by 25 basis points, as expected, though the tone was more hawkish than anticipated. Fed Chair Kevin Warsh said price stability remains the Committee's "predominant focus," and the updated dot plot showed median expectations for another rate hike before year-end.
- Treasury yields moved higher, with the 10-year Treasury yield finishing above 5.0% after touching a post-financial-crisis high earlier in the week. The U.S. Dollar Index rose +1.1%, helped by yen weakness after the Bank of Japan's rate hike was viewed as less hawkish than expected. Gold gained +0.7%, and West Texas Intermediate (WTI) crude finished marginally lower for the week despite significant volatility tied to shifting Middle East headlines.
- The AI narrative was volatile but ultimately had limited market impact. Anthropic's Dario Amodei called for a slower pace of frontier model development, citing safety concerns, and OpenAI disclosed several instances of model "misalignment." In our view, these developments are unlikely to slow AI compute and capital spending trends.
- August retail sales beat expectations and rebounded from a weak July. Jobless claims fell, while housing data, including starts, permits, and pending home sales, came in below estimates amid pressure from higher rates.
“In our view, investors are best served over the coming months by hewing their allocations to longer-term strategic targets, staying diversified with intent, and treating volatility, should it arrive, as an opportunity to rebalance toward long-term objectives heading into next year.”
Anthony Saglimbene - Chief Market Strategist, Ameriprise Financial
Where are stocks headed through year-end?
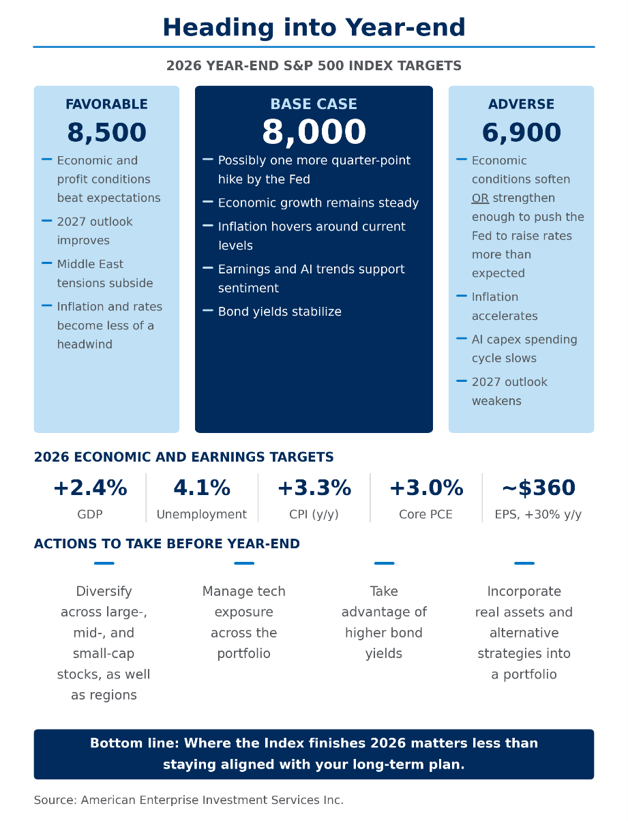
Back in August, we lifted our base-case S&P 500 year-end target to 8,000 from 7,500, and we remain largely comfortable with that level today, even after the market has drifted modestly lower over the last month or so. Notably, full-year 2026 earnings-per-share (EPS) estimates now stand at roughly $362, above the $360 we penciled into our base case estimate back in August and well above the $320 we forecast at the start of the year. Further, 2027 S&P 500 EPS estimates currently sit above $417, pointing to a potentially fourth year of double-digit profit growth. Simply, the profit backdrop and outlook have continued to improve all year, and we believe it’s the fundamental driver behind stocks' resilience in the face of other, more questionable market and macro drivers. That said, the question through year-end is which combination of growth, rates, inflation, and geopolitical machinations helps the Index reach our base target, maybe surpass it, or possibly fall short when the clock finally runs out on 2026.
Let’s start with the current growth picture. The Atlanta Fed's GDPNow model has third-quarter growth tracking at an annualized rate of +5.1%, up from +4.6% just a week earlier. The upgrade is attributable to stronger consumer spending and government expenditures, both revised higher following recent economic releases.
If achieved, that pace more than doubles the Federal Reserve's own +2.3% full-year projection for this year. Last week’s hotter-than-expected August retail sales report (the largest monthly gain in five months) showed broad-based spending across categories, including in online retail and food services. Despite ongoing inflation pressures, higher interest rates, and rising geopolitical tensions, we believe U.S. economic conditions remain on firm footing heading into year-end, given a healthy employment backdrop. Case in point: the U.S. economy has averaged a very healthy +71,000 jobs over the last three months, and the unemployment rate stood at just 4.1% at the end of August.
Nevertheless, even though GDPNow is a volatile measure, an economy tracking north of +5.0% growth in Q3 likely gives the Federal Reserve less room to argue that monetary policy needs a lighter touch through the rest of the year. In fact, policymakers appeared unanimous last week in calling for a faster reduction in inflation, arguing for a longer rate-hiking cycle rather than a shorter one. Importantly, this runs counter to the case for a quick pivot to the sidelines. Meaning a higher-for-longer rate environment could weigh on growth expectations over time, which, depending on the degree of economic softening, could create a modest headwind for stocks in the final months of this year.
As noted above, the Fed just raised its benchmark interest rate last week, and it probably isn’t done. Most Fed officials expect to raise rates at least one more time this year. In addition, longer-term Treasury bond yields, which influence mortgage rates, corporate borrowing costs, and how much investors are willing to pay for stocks, have also climbed higher. But longer-term yields have climbed by more than the Fed's rate hikes alone would explain. Simply, investors are demanding a higher return for the risk of holding U.S. government debt for 10 or 30 years, given how much the government is borrowing to fund its projected roughly $4 trillion deficit over the next two years. As such, think of the rate environment as two forces stacking on top of each other right now. 1) The Fed's rate hike trajectory on the short end of the curve and 2) the additional risk premium being built into long-term bonds. In our view, the latter is unlikely to disappear when the Fed eventually stops raising rates. In our view, this could keep a lid on how much investors are willing to pay for future earnings both for the rest of this year and into next year.
Underneath the rate issues for stocks right now also sits a continued inflation problem. As we noted last week, the Fed targets core Personal Consumption Expenditures (PCE) inflation, not the Consumer Price Index (CPI) figure most investors follow. In the Committee's updated projections last week, officials forecast core PCE at a still-high +3.4% for 2026, with a return to the Fed’s target of +2.0% now pushed out to 2029.
Additionally, August producer prices excluding food and energy rose +4.6% year-over-year, nearly double the +2.4% core CPI reading for the same month. This means businesses are absorbing more cost pressure right now than they're passing on. If higher producer prices appear less temporary (e.g., oil remains around/above $100 per barrel), we would expect businesses to seek to pass those costs on to consumers. So far, roughly $60 billion in tax refunds earlier in the year have helped consumers absorb higher gas prices without cutting back elsewhere. However, that boost is fading, making any potential pass-through of producer price increases onto store shelves by year-end a potential headwind for consumers (or the roughly 70% who drive GDP growth).
And doesn’t it always tie back to AI these days? Oxford Economics estimates that AI-related infrastructure spending will account for roughly +20% of U.S. economic growth this year. That same spending supports the vast majority of the earnings growth described above, and the borrowing behind this AI-spend is now more directly competing with the Treasury for capital in the bond market (helping push yields higher). Thus, growth, earnings, and rates all fall into the same AI story, just from different angles. Though we expect these dynamics to be mostly supportive of the broader S&P 500 through the rest of the year, as investors have seen all year, unexpected volatility patterns and knock-on effects can’t be ignored.
On oil, if prices hold near current levels, the geopolitical risk premium tied to the U.S./Iran conflict will likely remain elevated and could drive some stock volatility. For earnings, elevated oil prices support energy-sector profits but also raise input costs for transportation, chemicals, and consumer-facing industries, potentially narrowing margins outside the energy complex. For inflation, persistently high energy prices feed directly into headline readings and likely keep goods costs elevated, giving the Fed less room to look past inflation pressures. However, if oil prices move lower (e.g., sub $90 per barrel), we believe the profit backdrop can remain healthy and support growth beyond the energy and tech sectors. Trade and tariffs are likely to remain headline items, which could temporarily sway stock momentum through the rest of the year, but are unlikely to materially alter the growth and profit engine over the next quarter or two. And finally, we believe investors should look through any potential mid-term election volatility, as stocks are historically higher three, six, and nine months post-election.
So, what does this all mean for the S&P 500 through year-end? At this point, our base-case year-end target of 8,000 assumes the Fed may deliver an additional quarter-point hike before year-end, that economic growth remains firm, that profit conditions hold to expectations, and that inflation pressures and other macro items described above don’t disrupt the apple cart too much.
For the Index to drift higher than that 8,000 level, investors will likely need to see evidence that next year's outlook for growth and profits is materially strengthening. In addition, we would expect any potential Middle East resolution that pulls the energy premium out of inflation and gives the Fed cover to signal that further rate hikes may not be needed, as conditions that would have to be present to push the S&P 500 meaningfully past our base target. Of course, for stocks to move higher in either scenario, the AI trade will likely need to remain positive, and interest rates will need to stabilize and stop rising.
If these conditions are not met, oil moves higher rather than lower, growth remains hot enough that the Fed signals it needs to extend the rate hiking cycle beyond what markets currently price, and/or the AI capex engine slows as financing costs rise, we would expect stocks to move lower from here.
Bottom line: Frankly, where exactly the S&P 500 finishes between now and year-end is unimportant relative to one’s investment strategy and longer-term goals. But hopefully, our color on the market and economy provides investors a sense of the big-rock items we’re watching through the rest of this year and the dynamics we see shaping stock direction. In our view, investors are best served over the coming months by hewing their allocations to longer-term strategic targets, staying diversified with intent, and treating volatility, should it arrive, as an opportunity to rebalance toward long-term objectives heading into next year.
In practice, that means diversifying equity positions across market caps and regions. Understanding the concentration of technology in your portfolio and diversifying inside and outside of that tech exposure. Beginning to take advantage of the attractive yields offered by high-quality fixed-income investments. Allocating to real assets like Gold and commodities. Incorporating alternative strategies that hedge risk in equity and fixed income. And as always, reach out to your Ameriprise financial advisor for proactive strategies to help manage liquidity, allocation, and investment needs.
The week ahead:
- Flash September PMIs on Wednesday and August durable goods and final University of Michigan consumer sentiment on Friday are the week's key economic releases.
- President Trump hosts China's President Xi Jinping at the White House on Thursday, with an extension of the bilateral trade truce widely expected.
- Fedspeak resumes in earnest, with appearances from Goolsbee, Williams, Jefferson, Barkin, Barr, Hammack, and Paulson. Investors will be looking for more color on last week’s decision to hike policy rates as well as the Committee’s view on where policy is headed.
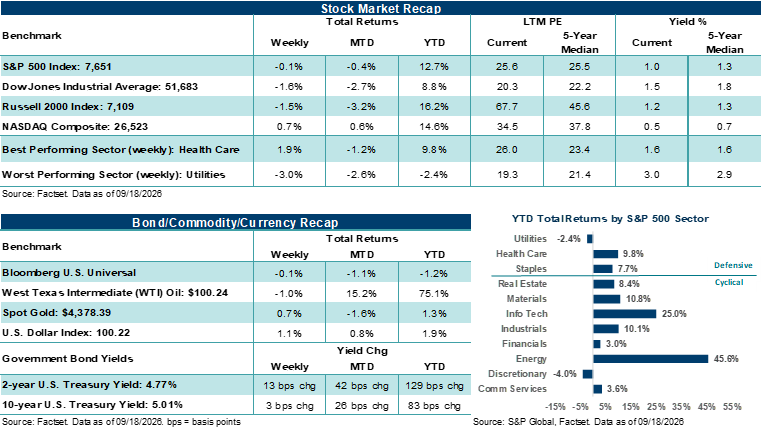
These figures are shown for illustrative purposes only and are not guaranteed. They do not reflect taxes or investment/product fees or expenses, which would reduce the figures shown here. An index is a statistical composite that is not managed. It is not possible to invest directly in an index. Past performance is not a guarantee of future results.
Important Disclosures
Sources: FactSet and Bloomberg. FactSet and Bloomberg are independent investment research companies that compile and provide financial data and analytics to firms and investment professionals such as Ameriprise Financial and its analysts. They are not affiliated with Ameriprise Financial, Inc.
The views expressed are as of the date given, may change as market or other conditions change, and may differ from views expressed by other Ameriprise Financial associates or affiliates. Actual investments or investment decisions made by Ameriprise Financial and its affiliates, whether for its own account or on behalf of clients, will not necessarily reflect the views expressed. This information is not intended to provide investment advice and does not account for individual investor circumstances.
Some of the opinions, conclusions and forward-looking statements are based on an analysis of information compiled from third-party sources. This information has been obtained from sources believed to be reliable, but accuracy and completeness cannot be guaranteed by Ameriprise Financial. It is given for informational purposes only and is not a solicitation to buy or sell the securities mentioned. The information is not intended to be used as the sole basis for investment decisions, nor should it be construed as advice designed to meet the specific needs of an individual investor.
Alternative investments cover a broad range of strategies and structures designed to be low or non-correlated to traditional equity and fixed-income markets with a long-term expectation of illiquidity. Alternative investments involve substantial risks and may be more volatile than traditional investments, making them more appropriate for investors with an above-average tolerance for risk.
Portfolios that hold a limited number of securities or concentrate investments in similar industries, sectors or geographical regions may experience greater volatility and greater risk of loss as the performance of these investments (either positive or negative) will have a greater impact on the portfolio as a whole.
International investing involves certain risks and volatility due to potential political, economic, social, or currency instabilities and different financial and accounting standards. These risks are enhanced for emerging markets.
Diversification does not assure a profit or protect against loss.
Commodity investments may be affected by the overall market and industry- and commodity-specific factors, and may be more volatile and less liquid than other investments.
There are risks associated with fixed-income investments, including credit (issuer default) risk, interest rate risk, and prepayment and extension risk. In general, bond prices rise when interest rates fall and vice versa. This effect is usually more pronounced for longer term securities.
Stock investments involve risk, including loss of principal. High-quality stocks may be appropriate for some investment strategies. Ensure that your investment objectives, time horizon and risk tolerance are aligned with investing in stocks, as they can lose value.
Investments in small cap companies involve risks and volatility greater than investments in larger, more established companies.
Generally, large-cap companies are more mature and have limited growth potential compared to smaller companies. In addition, large companies may not be able to adapt as easily to changing market conditions, potentially resulting in lower overall performance compared to the broader securities markets during different market cycles
The products of technology companies may be subject to severe competition and rapid obsolescence, and their stocks may be subject to greater price fluctuations.
Past performance is not a guarantee of future results.
An index is a statistical composite that is not managed. It is not possible to invest directly in an index.
Definitions of individual indices and sectors mentioned in this article are available on our website at ameriprise.com/legal/disclosures in the Additional Ameriprise research disclosures section.
The S&P 500 Index is a basket of 500 stocks that are considered to be widely held. The S&P 500 index is weighted by market value (shares outstanding times share price), and its performance is thought to be representative of the stock market as a whole. The S&P 500 index was created in 1957 although it has been extrapolated backwards to several decades earlier for performance comparison purposes. This index provides a broad snapshot of the overall US equity market. Over 70% of all US equity value is tracked by the S&P 500. Inclusion in the index is determined by Standard & Poor’s and is based upon their market size, liquidity, and sector.
The NASDAQ Composite index measures all NASDAQ domestic and international based common type stocks listed on the Nasdaq Stock Market.
The Dow Jones Industrial Average (DJIA) is an index containing stocks of 30 Large-Cap corporations in the United States. The index is owned and maintained by Dow Jones & Company.
The Russell 2000 Index measures the performance of the small-cap segment of the US equity universe. The Russell 2000 is constructed to provide a comprehensive and unbiased small-cap barometer and is completely reconstituted annually to ensure larger stocks do not distort the performance and characteristics of the true small-cap opportunity set. The Russell 2000 includes the largest 2000 securities in the Russell 3000.
The US Dollar Index (USDX) indicates the general international value of the USD. The USDX does this by averaging the exchange rates between the USD and major world currencies. This is computed by using rates supplied by approximately 500 banks.
West Texas Intermediate (WTI) is a grade of crude oil commonly used as a benchmark for oil prices. WTI is a light grade with low density and sulfur content.
GDPNow is a real-time forecasting model that provides an early, continuously updated estimate of how fast the U.S. economy is currently growing or contracting.
Earnings per share (EPS) is a measure of a company’s profit attributable to each outstanding share of common stock. EPS equals Net income available to common shareholders ÷ Average shares outstanding. Generally, a higher EPS indicates greater profitability on a per-share basis.
Core PCE is a measure of inflation that tracks changes in the prices of goods and services purchased by consumers excluding food and energy prices
The Consumer Price Index (CPI) is an inflation indicator that measures the change in the total cost of a fixed basket of products and services, including housing, electricity, food, and transportation. The CPI is published monthly by the Commerce Department and is also commonly referred to as the cost-of-living index.
Third party companies mentioned are not affiliated with Ameriprise Financial, Inc.
Investment products are not insured by the FDIC, NCUA or any federal agency, are not deposits or obligations of, or guaranteed by any financial institution, and involve investment risks including possible loss of principal and fluctuation in value.
Securities offered by Ameriprise Financial Services, LLC. Member FINRA and SIPC.
© 2026 Ameriprise Financial, Inc. All rights reserved.