Stocks limp to the Q3 finish line. Will higher rates cause more pain in Q4?
ANTHONY SAGLIMBENE – CHIEF MARKET STRATEGIST, AMERIPRISE FINANCIAL
WEEKLY MARKET PERSPECTIVES — October 5, 2026

U.S. stocks were mostly lower last week. Long-term Treasury yields reached their highest levels since 2002, and September jobs data missed estimates. This week, ISM Services, the September FOMC meeting minutes, and the preliminary October University of Michigan survey will be in focus.
Last week in review:
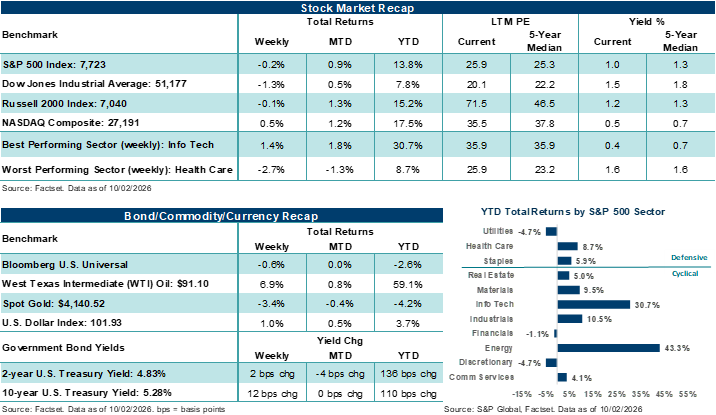
- The S&P 500 Index fell 0.3%, the Dow Jones Industrial Average dropped 1.3%, and the Russell 2000 Index slipped 0.2%. The NASDAQ Composite rose +0.5. Technology, Energy, and Utilities outperformed, while Healthcare and Financials lagged.
- The 10-year and 30-year Treasury yields hit their highest levels since 2002 before easing slightly, with the 10-year ending the week at 5.28% and the 30-year at 5.63%. Short-term yields dipped as expectations for a near-term rate hike eased. The U.S. Dollar Index rose +0.9%, and Gold fell 3.4%.
- September nonfarm payrolls rose +29,000, well below the roughly +90,000 expected. July and August were revised lower, with August cut to +133,000 from an initially reported +162,000. The unemployment rate rose to 4.2% from 4.1% as more people joined the labor force, and average hourly earnings rose +0.1% month over month, below expectations. Together with a cooler August core PCE reading, the reports lowered the odds of an October quarter-point rate hike to roughly 23%, down from 64% a week earlier.
- Other economic data was mixed. September ISM Manufacturing came in below consensus, though its prices-paid component jumped. Consumer confidence fell month over month, while jobless claims remained near cycle lows.
- AI headlines remained active. The Philadelphia Semiconductor Index rose +3.7% for a fifth straight weekly gain, and NVIDIA announced a record $150 billion buyback. OpenAI introduced a new agentic system at its developer conference, though it delayed the planned October release of a frontier model over control concerns. Anthropic's IPO prospectus reportedly showed $518 billion in future cloud and infrastructure commitments, with the listing expected in mid-November.
“Interest rates accelerated higher in September. Unsurprisingly, stocks and bonds both fell as borrowing costs climbed and the rate outlook grew less certain. In our view, it’s important to recognize that the S&P 500 and NASDAQ hid much of that weakness, as both indexes are dominated by large technology companies, which investors see as having durable AI-driven profits.”
Anthony Saglimbene - Chief Market Strategist, Ameriprise Financial
Stocks limp to the Q3 finish line. Will higher rates cause more pain in Q4?
The S&P 500 Index rose +2.0% in the third quarter, and the NASDAQ Composite gained +2.5%, while most other measures of the market fell. For example, the Dow Jones Industrial Average lost 2.7%, the small-cap Russell 2000 Index dropped 7.5%, and the equal-weighted S&P 500 declined 2.2%. By quarter's end, only about one in four S&P 500 stocks traded above their short-term trading average, down from roughly two-thirds at the end of Q2.
Simply, rising interest rates were the largest drag on stocks in Q3, especially in September. The 2-year Treasury yield rose 74 basis points in Q3, its largest quarterly increase since Q2'23. The 5-year yield topped 5.0% for the first time since 2007. And the 10-year yield finished September at 5.29%. Notably, the 10-year and 30-year reached their highest levels since 2002 in the final days of Q3.
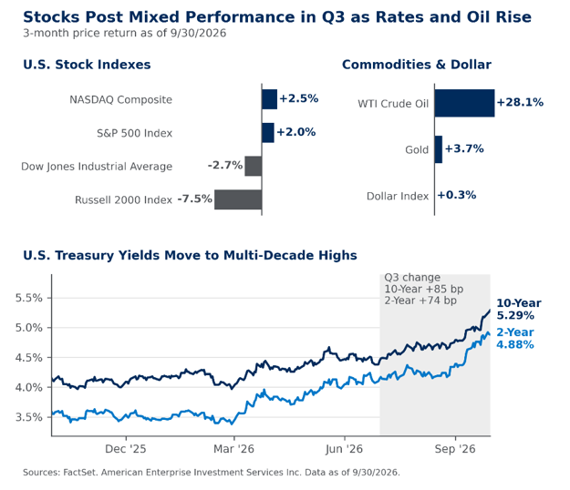
In our view, several forces simultaneously pushed yields higher. Inflation remained above the Fed's target, with core personal consumption expenditures (PCE) inflation sitting above +2.0% for 66 straight months. Higher oil and diesel prices during the quarter added to price pressures, and producer prices came in firmer than expected. Growth also remained solid. Nonfarm payrolls averaged roughly 50,000 per month in Q3. In addition, September's flash composite purchasing managers' index (PMI) reached its highest level since July 2021. Importantly, concerns about federal deficits, weak Treasury auctions, and heavy AI-related corporate borrowing added further pressure on longer-term yields throughout Q3.
That backdrop led the Federal Reserve to raise rates by 25 basis points in September, its first hike since July 2023. Fed Chair Kevin Warsh said the committee would be hard-pressed to call monetary policy restrictive, and other Fed officials echoed that sentiment. The committee and markets currently expect another quarter-point rate hike by December.
As one might expect, rate-sensitive sectors took the largest losses in Q3. Utilities fell 13.0%, the worst of any S&P 500 sector, and Real Estate dropped 6.3%, as Treasury yields near or above 5.0% gave income investors an attractive alternative. Further, small caps, homebuilders, building products, and housing-related retailers fell in Q3 as financing costs and affordability pressures rose. Banks and credit card companies also saw steep declines as the yield curve flattened. Notably, higher interest rates and fuel costs also weighed on economically sensitive stocks. Industrials fell 9.9%, with weakness across trucking, rail, parcel delivery, airlines, and aerospace and defense. Consumer Discretionary declined 5.2% as restaurants, travel and leisure, autos, and casino stocks lost ground. And Materials (-3.2%) and Consumer Staples (-2.4%) also declined in Q3.
That said, most of the market’s pain was felt in September. Although the S&P 500 slipped just -0.5% for the month, the equal-weight S&P 500 fell 5.2%, while the Russell 2000 posted its largest monthly decline since March 2025. Five sectors lost more than 5.5%, with Financials, Materials, Real Estate, and Utilities each down more than 6.0% in September. Technology and Communication Services were the only sectors to finish the final month of Q3 higher, each gaining more than +4.0%, as investors gravitated to areas with visible/secular profit drivers.
Outside of stocks, oil prices rose as the U.S./Iran conflict remained unresolved. The June 18 U.S./Iran memorandum of understanding fell apart in mid-July, when Iran attacked vessels in the Strait of Hormuz, and the U.S. responded with strikes. Houthi attacks on Saudi Arabia's energy infrastructure, which temporarily closed the regionally significant East-West pipeline in mid-September, kept crude prices elevated, with diesel topping $6.00 a gallon in Q3. However, oil supply improved late in the quarter as flows through the Strait increased and the East-West pipeline partially reopened. For the quarter, WTI crude rose +28%, and diesel rose +45.2%
On the positive side of the ledger, Energy led all sectors with a +16.5% gain in Q3, with refiners at the front of the group as fuel prices rose. Technology rose +7.1% as AI demand offset rate pressure, though results varied within the sector. Semiconductors fell 11.4% in Q3 after gaining more than +230% over the prior six quarters, as investors grew more cautious about AI spending, monetization, and safety. Conversely, Software rose +17.5% as fears that AI would disrupt subscription software businesses eased, and tech hardware outperformed. Yet chip stocks began to rebound in September as new model releases and early adoption of AI agents suggested durable demand.
Importantly, we believe corporate profits kept a lid on the selling pressure. S&P 500 second-quarter earnings per share (EPS) grew nearly +53% year-over-year, and 86% of companies beat estimates, the highest share since Q2'21. Consensus expects Q3 earnings growth near +29%, which would mark a third straight quarter above +25%.
Finally, the U.S. declined to extend the U.S.-Mexico-Canada Agreement, and the U.S./China trade truce was extended to January 10th. Gold rose +3.7% for the quarter, and the U.S. Dollar Index finished roughly flat.
Looking ahead: Interest rates accelerated higher in September. Unsurprisingly, stocks and bonds both fell as borrowing costs climbed and the rate outlook grew less certain. In our view, it’s important to recognize that the S&P 500 and NASDAQ hid much of that weakness, as both indexes are dominated by large technology companies, which investors see as having durable AI-driven profits. Even so, borrowing costs are now higher than at any point this year. If investors' confidence in the future weakens, we wouldn’t be surprised if that tech durability is eventually tested.
Thus, we believe the direction of interest rates is the most important macro factor to watch as the fourth quarter begins. Investors likely want to see yields settle at a stable level sooner rather than later. Whether that happens depends on the outlook for deficit, supply and competition factors, as well as how far the Fed goes with rate hikes, and whether growth remains firm without fueling inflation. Notably, corporate profits remain the market's primary support beam, and with expectations high, companies can ill-afford to disappoint.
However, stocks have historically weathered rising-rate periods when the economy and profits kept growing. In our view, stocks have room to move higher if the 2027 outlook for growth and profits remains firm, energy prices stabilize/fall, and the Fed signals its rate-hiking path will be short-lived. Of course, any advance in stock prices through year-end will likely require a steady AI trade as well.
Finally, we would be remiss if we didn’t point out that elevated interest rates increase the risk that something could break in the economy or that expectations for slower growth and weaker profits may feed on each other. That’s the primary risk from our vantage point heading into year-end. Higher oil prices, more Fed tightening than markets expect, or slower AI spending as financing costs rise, would also likely produce meaningful headwinds in the final months of the year.
Bottom line: As we noted a couple of weeks ago, where stocks finish the year matters far less than an investor's long-term strategy. In our view, investors are best served by keeping allocations close to strategic targets, staying diversified, and using volatility to rebalance heading into 2027. That means diversifying across company sizes and regions, managing technology concentration, locking in attractive yields on high-quality bonds, and adding real assets and alternative strategies to your portfolio. We suggest reaching out to your Ameriprise financial advisor to put these strategies to work sooner, rather than later.
The week ahead:
- September ISM Services on Monday, the September FOMC meeting minutes on Wednesday, and preliminary October University of Michigan consumer sentiment and inflation expectations on Friday are the week's key releases.
- The U.S. Treasury will auction $58 billion in 3-year notes, $39 billion in 10-year notes, and $22 billion in 30-year bonds.
- The Q3 earnings season kicks off to a quiet start, with PepsiCo, Delta Air Lines, and Constellation Brands reporting this week, and ahead of the big banks opening the third-quarter earnings season next week.
These figures are shown for illustrative purposes only and are not guaranteed. They do not reflect taxes or investment/product fees or expenses, which would reduce the figures shown here. An index is a statistical composite that is not managed. It is not possible to invest directly in an index. Past performance is not a guarantee of future results.
Important Disclosures
Sources: FactSet and Bloomberg. FactSet and Bloomberg are independent investment research companies that compile and provide financial data and analytics to firms and investment professionals such as Ameriprise Financial and its analysts. They are not affiliated with Ameriprise Financial, Inc.
The views expressed are as of the date given, may change as market or other conditions change, and may differ from views expressed by other Ameriprise Financial associates or affiliates. Actual investments or investment decisions made by Ameriprise Financial and its affiliates, whether for its own account or on behalf of clients, will not necessarily reflect the views expressed. This information is not intended to provide investment advice and does not account for individual investor circumstances.
Some of the opinions, conclusions and forward-looking statements are based on an analysis of information compiled from third-party sources. This information has been obtained from sources believed to be reliable, but accuracy and completeness cannot be guaranteed by Ameriprise Financial. It is given for informational purposes only and is not a solicitation to buy or sell the securities mentioned. The information is not intended to be used as the sole basis for investment decisions, nor should it be construed as advice designed to meet the specific needs of an individual investor.
Alternative investments cover a broad range of strategies and structures designed to be low or non-correlated to traditional equity and fixed-income markets with a long-term expectation of illiquidity. Alternative investments involve substantial risks and may be more volatile than traditional investments, making them more appropriate for investors with an above-average tolerance for risk.
Portfolios that hold a limited number of securities or concentrate investments in similar industries, sectors or geographical regions may experience greater volatility and greater risk of loss as the performance of these investments (either positive or negative) will have a greater impact on the portfolio as a whole.
International investing involves certain risks and volatility due to potential political, economic, social, or currency instabilities and different financial and accounting standards. These risks are enhanced for emerging markets.
Diversification does not assure a profit or protect against loss.
Commodity investments may be affected by the overall market and industry- and commodity-specific factors, and may be more volatile and less liquid than other investments.
There are risks associated with fixed-income investments, including credit (issuer default) risk, interest rate risk, and prepayment and extension risk. In general, bond prices rise when interest rates fall and vice versa. This effect is usually more pronounced for longer term securities.
Stock investments involve risk, including loss of principal. High-quality stocks may be appropriate for some investment strategies. Ensure that your investment objectives, time horizon and risk tolerance are aligned with investing in stocks, as they can lose value.
Investments in small cap companies involve risks and volatility greater than investments in larger, more established companies.
Generally, large-cap companies are more mature and have limited growth potential compared to smaller companies. In addition, large companies may not be able to adapt as easily to changing market conditions, potentially resulting in lower overall performance compared to the broader securities markets during different market cycles
The products of technology companies may be subject to severe competition and rapid obsolescence, and their stocks may be subject to greater price fluctuations.
Past performance is not a guarantee of future results.
An index is a statistical composite that is not managed. It is not possible to invest directly in an index.
Definitions of individual indices and sectors mentioned in this article are available on our website at ameriprise.com/legal/disclosures in the Additional Ameriprise research disclosures section.
The S&P 500 Index is a basket of 500 stocks that are considered to be widely held. The S&P 500 index is weighted by market value (shares outstanding times share price), and its performance is thought to be representative of the stock market as a whole. The S&P 500 index was created in 1957 although it has been extrapolated backwards to several decades earlier for performance comparison purposes. This index provides a broad snapshot of the overall US equity market. Over 70% of all US equity value is tracked by the S&P 500. Inclusion in the index is determined by Standard & Poor’s and is based upon their market size, liquidity, and sector.
The NASDAQ Composite index measures all NASDAQ domestic and international based common type stocks listed on the Nasdaq Stock Market.
The Dow Jones Industrial Average (DJIA) is an index containing stocks of 30 Large-Cap corporations in the United States. The index is owned and maintained by Dow Jones & Company.
The Russell 2000 Index measures the performance of the small-cap segment of the US equity universe. The Russell 2000 is constructed to provide a comprehensive and unbiased small-cap barometer and is completely reconstituted annually to ensure larger stocks do not distort the performance and characteristics of the true small-cap opportunity set. The Russell 2000 includes the largest 2000 securities in the Russell 3000.
The US Dollar Index (USDX) indicates the general international value of the USD. The USDX does this by averaging the exchange rates between the USD and major world currencies. This is computed by using rates supplied by approximately 500 banks.
West Texas Intermediate (WTI) is a grade of crude oil commonly used as a benchmark for oil prices. WTI is a light grade with low density and sulfur content.
Earnings per share (EPS) is a measure of a company’s profit attributable to each outstanding share of common stock. EPS equals Net income available to common shareholders ÷ Average shares outstanding. Generally, a higher EPS indicates greater profitability on a per-share basis.
Core PCE is a measure of inflation that tracks changes in the prices of goods and services purchased by consumers excluding food and energy prices.
Personal consumption expenditures (PCE) are a measure of the outlays or how much consumers are spending. The PCE reading is released monthly by the Bureau of Economic Analysis.
The Philadelphia Semiconductor Index (SOX) is a stock market index that tracks the performance of companies in the semiconductor (chip) industry.
ISM Manufacturing Report: A monthly survey-based economic indicator issued by the Institute for Supply Management that assesses changes in manufacturing activity, including new orders, production, employment, supplier deliveries, and inventories, to identify expansion or contraction in the U.S. manufacturing sector.
Third party companies mentioned are not affiliated with Ameriprise Financial, Inc.
Investment products are not insured by the FDIC, NCUA or any federal agency, are not deposits or obligations of, or guaranteed by any financial institution, and involve investment risks including possible loss of principal and fluctuation in value.
Securities offered by Ameriprise Financial Services, LLC. Member FINRA and SIPC.
© 2026 Ameriprise Financial, Inc. All rights reserved.