So, you’re worried about an AI bubble.
ANTHONY SAGLIMBENE – CHIEF MARKET STRATEGIST, AMERIPRISE FINANCIAL
WEEKLY MARKET PERSPECTIVES — July 13, 2026

U.S. stocks finished mixed last week. The S&P 500 Index and NASDAQ Composite rose for the fourth time in five weeks as AI capital spending headlines offset renewed Middle East tensions and a modest backup in Treasury yields. This week, June inflation reports, retail sales, Fed Chair Kevin Warsh's first semiannual testimony to Congress, and the start of second-quarter earnings season all make for a busy week for investors.
Last week in review:
- The S&P 500 Index rose +1.3%, while the NASDAQ Composite gained +1.7%. The Dow Jones Industrial Average slipped 0.5%, and the Russell 2000 Index fell 0.6%. Meta Platforms led the large-cap technology gainers, rising +14.8% on AI capital-spending headlines. The Philadelphia Semiconductor Index rose +2.7% after two weeks of declines.
- Treasury prices weakened, and the yield curve steepened. The week's $119 billion in 3-year, 10-year, and 30-year auctions were well received. The U.S. Dollar Index edged higher. Gold slipped lower. And West Texas Intermediate (WTI) crude rose +2.4%, its first weekly gain in four weeks on renewed Middle East tensions.
- June ISM Services was in line but softer month over month. June existing home sales fell more than expected on affordability concerns. Jobless claims were little changed. And the Federal Reserve's June meeting minutes reflected continued divisions from the committee on inflation and rate policy but offered no new signals.
- Geopolitics moved back into focus. Multiple rounds of U.S./Iran strikes and counterstrikes were triggered by Iranian pressure on Strait of Hormuz shipping. President Trump said the ceasefire and Memorandum of Understanding are over, though talks are expected to continue. Market expectations for a return to a full "hot war" remain limited.
- AI headlines drove much of the action. Meta Platforms rallied on plans to add 14 gigawatts of compute capacity by 2027. CEO Mark Zuckerberg pushed back against concerns about excess capacity. NVIDIA gained on reports that China will permit limited buying of its H200 chips. Broadcom and Apple announced a $30 billion-plus multiyear deal for U.S.-produced custom components. And Micron Technology raised its capital spending plan to $250 billion through 2035.
- In our view, last week's action showed a market still leaning on the AI capital spending story while working through pockets of positioning stress and higher oil prices. We believe some momentum stabilization is a healthy sign, but the broadening trade struggled again as rates and energy moved higher. Heading into the second-quarter earnings season, the bar is elevated, raising the stakes for corporate guidance to justify current valuations.
“The bubble patterns showing up today in the AI cycle are the same ones that usually show up in prior bubbles. The value of history is not in predicting the timing. It's about preparing for a range of possible outcomes in advance, including ones that aren’t all sunshine and rainbows. Investors who can smartly diversify around big secular cycles, who anchor on time horizon and risk, and who rebalance and diversify with discipline are usually the investors who compound wealth across time.”
Anthony Saglimbene - Chief Market Strategist, Ameriprise Financial
So, you’re worried about an AI bubble.
The AI trade enters the back half of 2026 at another important inflection point, as investors are becoming more selective about what they’re willing to pay for AI exposure. July has brought increased volatility across this year’s biggest winners. For example, NVIDIA has shed over 10% since its May 14 peak. The Philadelphia Semiconductor Index has given back over 11% since its June high, after a nearly +89% run in Q2. And nearly 60% of the stocks in the S&P 500 Information Technology Index are down 20% or more from their recent highs. Thus, the Q2 earnings season, beginning this week, will be a critical test of whether AI spending is delivering returns that justify the capex being deployed.
With that backdrop in mind, a familiar debate has again resurfaced: Is AI in a bubble? It's a fair question, but a yes-or-no answer won't get investors anywhere, in our view. A more useful exercise is to step back and ask what centuries of financial history can tell us about how bubbles actually form, unfold, and end. Here, the pattern is pretty consistent across time. And in our view, understanding that pattern matters far more than predicting the timing of the next bubble.
What’s a bubble? To start, asset bubbles are rare. True full-scale bubbles occur perhaps once or twice every few decades. And while speculative excess is common, bubbles are not. We believe Warren Buffett captured the dynamic well in his 2001 letter to Berkshire Hathaway shareholders: "A pin lies in wait for every bubble. And when the two eventually meet, a new wave of investors learns some very old lessons: First, many in Wall Street, a community in which quality control is not prized, will sell investors anything they will buy. Second, speculation is most dangerous when it looks easiest." Importantly, asset bubbles don't usually form around smoke and mirrors. Instead, they are often grounded in real transformations happening in the economy that investors, at some point, extend too far.
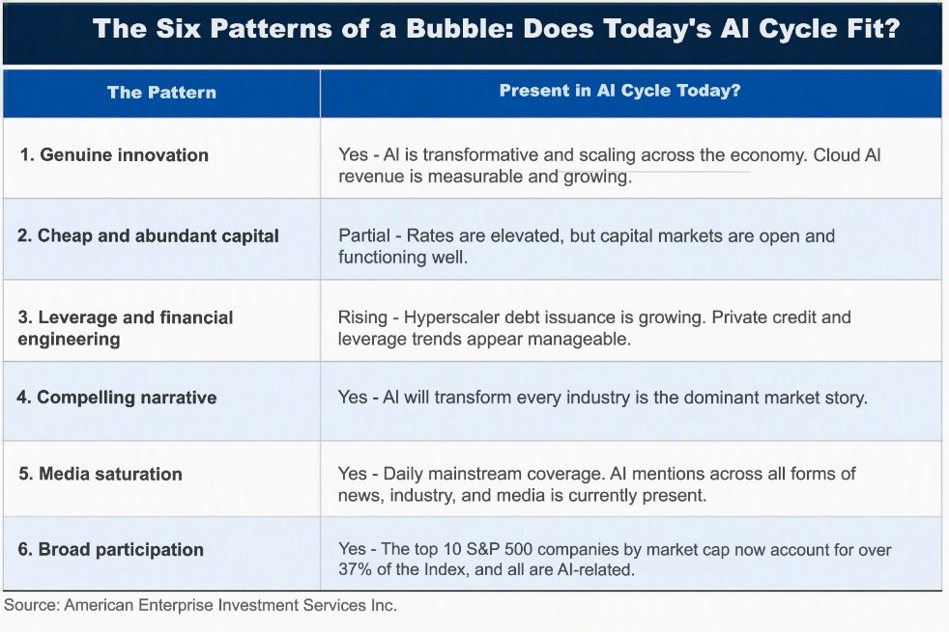
Market historians, such as Barry Ritholtz, have distilled the common architecture of every major bubble in history into recurring elements. First, a genuine technological or commercial innovation provides the foundation. Second, cheap and abundant capital fuels investment. Third, leverage and financial engineering amplify the leg higher. Fourth, a compelling narrative justifies elevated prices, usually a version of the idea that this time is different. Fifth, media coverage saturates and normalizes the theme. Sixth, herd behavior and broad participation across social classes mark the late innings. Three additional patterns also show up repeatedly. The underlying infrastructure often survives the bubble even when the shareholders financing it incur losses. Equity markets typically peak before physical capex peaks, meaning stocks turn lower before the buildout slows. And the collapse is almost always faster than the ascent, with recovery timelines that can span years.
What history tells us: Interestingly, the Tulip Mania in the Dutch Republic during the 1630s was the first recorded modern bubble. Rare bulbs became a status symbol among the wealthy, and by early 1637, a single bulb could trade for more than 10 times what a skilled artisan earned in a year. The collapse came in February 1637 when an auction failed to draw bids, and prices collapsed within days. Japan's 1980s asset bubble is one of the largest of the modern era. Cheap credit from the Bank of Japan following the 1985 Plaza Accord fueled speculation across both stocks and real estate. The Nikkei 225 rose from under 7,000 to nearly 39,000 during the decade, and at the peak, Japan’s equity market capitalization was over 2 times the country’s own GDP, according to Bloomberg. It took roughly 34 years for the Nikkei to reclaim its 1989 peak, one of the longest recovery periods for any major global stock index in history.
Closer to home, the 2008 Global Financial Crisis is the most recent full-scale bubble U.S. investors lived through, and the setup was familiar. Cheap credit, financial engineering through mortgage-backed securities and collateralized debt obligations and a widely accepted narrative that U.S. home prices had never fallen on a national basis in the post-war era. Household leverage climbed, subprime lending scaled, and the S&P/Case-Shiller National Home Price Index roughly doubled between 2000 and its 2006 peak, per S&P Dow Jones Indices. The unwind was fast and broad. National home prices fell roughly 26% peak-to-trough, according to S&P/Case-Shiller, and the S&P 500 Index declined 57% between its October 2007 peak and its March 2009 trough. The Index didn't reclaim its 2007 high until March 2013. Notably, the housing collapse rolled through the banking system, credit markets, and the real economy, a reminder that bubble unwinds don’t always stay contained to the asset at the center.
Of course, the 2000s dot-com bubble is the most direct analog for today. The internet was a genuinely transformative technology, and enthusiasm in the late 1990s was warranted, though the fiber-optic buildout proved to be too aggressive for demand at the time. The NASDAQ Composite rose roughly sixfold between 1995 and its March 2000 peak, then fell approximately 78% by October 2002. Cisco Systems, briefly the world's most valuable company at roughly $500 billion, traded at extreme multiples of earnings by any measure. Notably, the NASDAQ didn’t reclaim its 2000 peak until April 2015. Although the internet ultimately delivered on its promise and then some, many of the companies and investors carrying that promise were severely disrupted when the bubble popped.
How does the AI cycle map to a bubble framework? Let’s compare today’s AI cycle against the same six bubble patterns discussed above. Genuine innovation? AI is unambiguously transformative. Enterprise adoption is scaling. Cloud AI revenue at the major hyperscalers is measurable and growing rapidly. Cheap and abundant capital? Interest rates are elevated, but capital markets remain wide open for business. Hyperscaler debt issuance has been growing, and private credit has stepped in to fund the buildout of AI infrastructure. Leverage and financial engineering? Rising, but not extreme, in our view. Amazon’s recent $25 billion bond deal, NVIDIA's $25 billion issuance, and private credit's expanding role in data-center financing signal growing use of debt and leverage to fund the buildout. A compelling narrative? "AI will transform every industry" has become the dominant market story. Media saturation? AI is now covered daily in mainstream news everywhere. Broad participation? The top 10 names in the S&P 500 Index are now approaching 40% by market-cap weight, and all are AI-related. That level of concentration means most diversified portfolios already carry heavy AI exposure, whether investors intended it or not.
In total, we count at least four of the six bubble elements present today to varying degrees. Whether that constitutes a bubble or a sustainable investment cycle, for now, depends on whether AI revenues ultimately justify the spending. That’s why Q2 earnings and the profit updates ahead will be ever more consequential in shaping the bubble debate.
What investors should consider doing today: Even when knowing the hallmarks of a bubble, timing the pop is nearly impossible. And to be honest, investors seldom accurately identify a bubble in real time, even when strategists like us are doing our best crystal ball exercises. Investors should start with one simple question right now: “If my portfolio dropped 10%, 20%, 30%, etc., would I be comfortable with how I’m positioned and what I own today?” Start with time horizon. An investor with a 4–7-year horizon should approach today’s market risks more guardedly than one with a 16+ year horizon. In addition, retirees drawing on portfolios today face far different math than accumulators still investing, where drawing down portfolios in a potential bear market can do irreversible damage. For example, retirees and pre-retirees should consider building a cash reserve capable of sustaining a lifestyle for several years. The point is to avoid drawing on the portfolio's growth components during a bear market. Notably, one builds these positions when times are good (like now), not when markets are faltering.
In tax-advantaged accounts, investors should consider rebalancing more frequently. Concentration risks often build in a rapidly expanding market environment, and when generational themes are present. If AI-heavy names have pushed allocations meaningfully above strategic thresholds, rebalancing back to targets more frequently than once a year can help mitigate risk. Also, diversify, diversify, diversify. Smaller-capitalization stocks, international equities, dividend payers, defensives, bonds, cash, and alternatives can all help insulate portfolios from a potential AI-driven drawdown. Finally, reframe your measure of investment success. In our view, most investors are best served by participating in market gains rather than by chasing outperformance. Diversification and risk-mitigation strategies can help create peace of mind and a proactive approach to scenarios history tells us occur over time. But there’s a trade-off. Diversification underperforms when growth leadership dominates. But the alternative, concentrated exposure held all the way through a potential bubble unwind, combined with poor timing behaviors that follow, has costs that most investors seldom can afford to incur.
Bottom Line: To be clear, we aren’t calling for the end of the AI cycle any time soon, which may still have years of benefit for investors. AI technology is transformative and young, demand is real, and the earnings evidence continues to support the theme. And while we believe further stock upside from here is more likely than not, every prior bubble looked defensible on fundamentals until it didn't. Importantly, the bubble patterns showing up today in the AI cycle are the same ones that usually show up in prior bubbles. The value of history is not in predicting the timing. It's about preparing for a range of possible outcomes in advance, including ones that aren’t all sunshine and rainbows. Investors who can smartly diversify around big secular cycles, who anchor on time horizon and risk, and who rebalance and diversify with discipline are usually the investors who compound wealth across time. Simply, we believe investors should focus on the elements within their control and have a plan for a bear market, even if the current bull market has more room to run.
The week ahead:
- June CPI on Tuesday and June PPI on Wednesday will be the week's key inflation reads. June retail sales on Thursday will offer the latest look at consumer spending.
- Fed Chair Kevin Warsh delivers his first semiannual monetary policy testimony to Congress on Tuesday and Wednesday. The Federal Reserve's Beige Book is also due on Wednesday.
- Second-quarter earnings season kicks off in earnest with JPMorgan Chase, Bank of America, Wells Fargo, Citigroup, and Goldman Sachs reporting Tuesday. Morgan Stanley reports on Wednesday, followed by Johnson & Johnson, UnitedHealth Group, and Netflix later in the week.
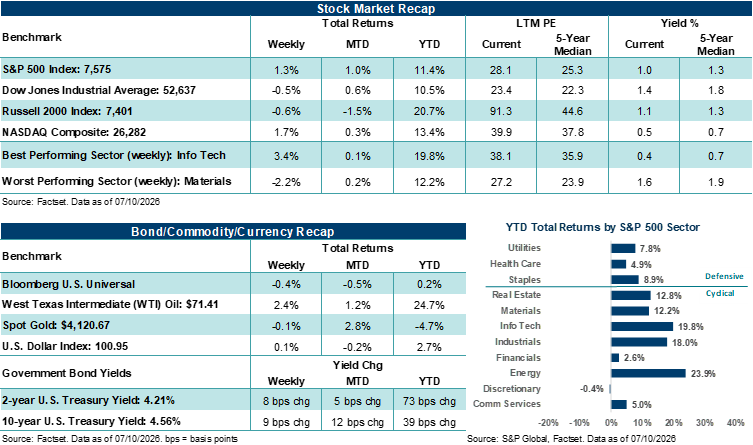
These figures are shown for illustrative purposes only and are not guaranteed. They do not reflect taxes or investment/product fees or expenses, which would reduce the figures shown here. An index is a statistical composite that is not managed. It is not possible to invest directly in an index. Past performance is not a guarantee of future results.
© 2026 Ameriprise Financial, Inc. All rights reserved.