Black Friday spending sets a record. Can stocks coast into year-end?
ANTHONY SAGLIMBENE – CHIEF MARKET STRATEGIST, AMERIPRISE FINANCIAL
WEEKLY MARKET PERSPECTIVES — November 27, 2023

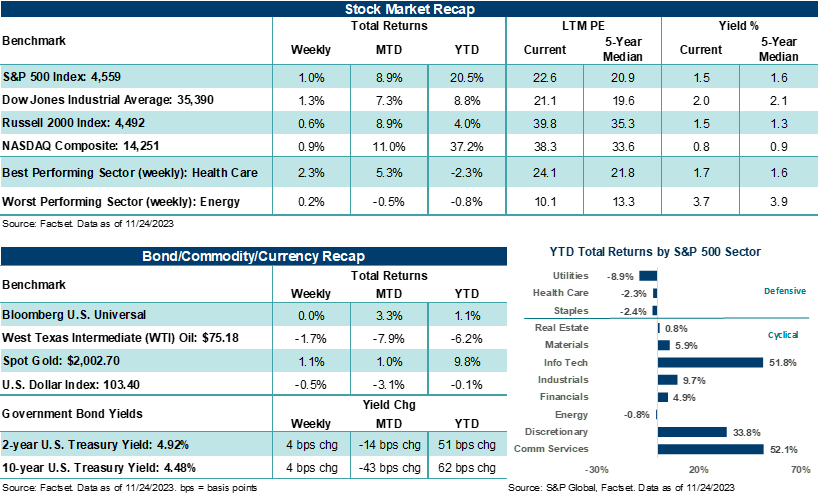
U.S. stocks recorded their fourth-straight week of gains in a shortened holiday week that included U.S. markets being closed for Thanksgiving and an abbreviated trading session on Friday. The four-week win streak is the longest for the S&P 500 Index (+1.0%) and the NASDAQ Composite (+0.9%) since June. The Dow Jones Industrials Average gained +1.3% in the shortened holiday week, stringing together its longest weekly winning streak since April.
With just a few days before month-end, the S&P 500 is on pace for its best month since July 2022 and a November gain that surpasses all but five of the best November returns going back to 1928. Notably, stock volatility has retreated to levels not seen since before the pandemic in late 2019. Simply, an investor “reset” of rate expectations over recent weeks, where the Federal Reserve could potentially cut its fed funds rate several times next year and where market-based interest rates can drift lower has put stock prices back on an upward path. Still, firm economic conditions, combined with improving year-over-year corporate profit trends, have also given stocks a new lease on life late in the year.
“With investors having some time off to enjoy the Thanksgiving holiday last week, the market’s attention turned to the holiday shopping season kicking into high gear.”
Anthony Saglimbene - Chief Market Strategist, Ameriprise Financial
With the books about to close on November, the S&P 500 is higher by roughly +9.0% month-to-date, while the NASDAQ is up a stunning +11.0% this month. As one might expect, risk-on trading over recent weeks has started to shift some of this year’s entrenched fund flow trends. According to the latest weekly EPFR Global data, global stock funds took in $40 billion in inflows over the last two weeks ending on November 21st — the most since February 2022. Additionally, investment-grade bond funds saw their largest week of inflows in fifteen weeks, while Technology stock funds saw their strongest week of inflows in twelve weeks. Interestingly, nearly $11.5 billion flowed into high-yield junk bonds, which may start to indicate dampened investor concerns about high borrowing costs leading to a spike in defaults. Bottom line: Several weeks of stocks melting higher, reduced interest rate fears, and evidence of still solid growth trends in the U.S. have led investors to dip their toes back into risk assets. With over $5.7 trillion currently sitting in money market funds, which has increased over +24% in the last twelve months, we believe plenty of dry powder is on the sidelines to help stocks push higher if macroeconomic conditions cooperate.
Could the Fed’s goldilocks scenario be in reach?
According to the latest Atlanta Federal Reserve’s GDPNOW forecast, the U.S. economy could grow by +2.1% in the current quarter and after accelerating higher by +4.9% in the third quarter. Based on FactSet estimates, S&P 500 earnings per share (EPS) are expected to grow by +2.8% year-over-year in the fourth quarter, which is substantially down from the +8.2% expected at the end of September. In both cases, growth expectations for the economy and corporate profits now seem aligned with a view of moderating (but positive) growth in the final three months of the year. Looking ahead, we see the U.S. economy growing by a little less than +1.5% next year, while corporate profits could grow year-over-year by a high-single-digit or low-single-digit figure. And if core inflation can moderate to the Fed’s target by the middle of next year, then we suspect government bond yields could also moderate lower throughout next year. Of course, avoiding a large spike in unemployment would also be needed to attain positive economic and profit growth next year. Such conditions would be consistent with the soft-landing scenario and possibly allow the Fed to cut its fed funds target rate in the second half. While this is certainly the Goldilocks scenario and really doesn’t allow for much to go wrong in the process, it’s a scenario that remains plausible and is why we believe stocks have found their footing late in the year. Through yearend, the November nonfarm payrolls report (December 8), November CPI (December 12), and the FOMC decision on December 13 are the last major hurdles stocks will need to move through before the bow is placed on the year. If these last few events next month do not surprise investors (which we believe they won’t), we suspect stocks could gravitate a little higher and close 2023 on a high note.
Turning back to last week, much of the week was devoid of any major market-moving catalysts. A first look at November manufacturing activity showed an unexpected decline and the lowest print in three months. However, services activity this month rose unexpectedly and sits at its highest reading in four months. Though the twelve-month outlook for service providers softened, the current release showed the first expansion in new business in four months. Bottom line: Trends across manufacturing remain fragile, and activity in the U.S. has struggled to meaningfully return to expansion territory all year. However, the services side of the economy remains firm, as businesses and consumers concentrate their spending on areas outside of goods and goods-related items. Taken as a whole, economic activity appears more balanced compared to earlier in the year (which is a positive), but one where the service side of the economy continues to hold sway.
Investors turn their attention to holiday shopping
With investors having some time off to enjoy the Thanksgiving holiday last week, the market’s attention turned to the holiday shopping season kicking into high gear. The National Retail Federation projects total holiday season sales this year (November through December) to come in around 3% to 4% higher than last year, or between roughly $957 billion and $967 billion. The pace would be consistent with the average annual holiday spending increase seen from 2010 to 2019 and before the pandemic. However, with consumers’ focus increasingly turning to online shopping during the holiday season, data from Adobe Analytics can provide an almost real-time assessment of consumer behavior during a period when many retailers see the bulk of their sales for the year. Adobe tracks and analyzes over one trillion visits to U.S. retail websites across eighteen product categories and 100 million different products. In October, Adobe forecasted that U.S. online holiday sales would reach nearly $222 billion this year, representing a +4.8% boost over 2022 spending levels. Over Cyber Week, which includes Thanksgiving, Black Friday, and Cyber Monday, Adobe expects online sales to reach roughly $37 billion, which would be +5.4% above last year’s total.
According to Adobe Analytics, Black Friday e-commerce spending in the U.S. this year rose an impressive +7.5% from a year earlier, coming in at a record $9.8 billion. Mastercard SpendingPulse found that Black Friday sales at U.S. retail stores were up +2.5% year-over-year, as high levels of promotions helped attract shoppers. On Thanksgiving Day, consumers spent $5.6 billion online. Adobe sees online sales during Cyber Monday reaching a record $12 billion. Interestingly, $79 million of sales on Black Friday came from consumers using the “Buy Now, Pay Later” payment method, up +47% from last year. Several forecasts for this year’s holiday spending pointed to an increasingly cost-conscious consumer willing to spend but looking for deals and ways to manage their budgets. Yet, given inflation has moderated since this time last year and unemployment remains low, we believe the holiday shopping season should deliver a fair amount of cheer to retailers that have the goods and services consumers desire.
Finally, government bond yields moved in a tight range last week, following yields hitting multi-month lows. The latest FOMC minutes showed policymakers believe further rate tightening could be appropriate if current policy does not tame inflation, though all members thought the committee should proceed cautiously. The U.S. Dollar Index dipped lower, Gold pressed back above $2,000 per ounce, and West Texas Intermediate (WTI) crude settled the week at $75.18 per barrel. OPEC delayed its anticipated November 26th policy meeting last week without providing any details. Reports suggest Saudi Arabia is having increasing trouble convincing other members to further reduce output to maintain prices.
The week ahead
The calendar will shift into December this week, a month that over the last handful of years has seen the S&P 500 either aggressively add to its year-to-date gains or aggressively tack on to its losses. Thankfully, this year, the Index is on track for solid year-to-date gains, and macroeconomic conditions appear to be moving in a supportive direction. That said, upcoming reports on employment, inflation, and monetary policy in December should not be dismissed as automatically supportive for stocks and just a formality on the way to a gentle end-of-year rally. This week, investors will get several updates on the housing market, the latest read on Consumer Confidence, a second look at Q3 GDP, October PCE inflation, and November ISM manufacturing.
These figures are shown for illustrative purposes only and are not guaranteed. They do not reflect taxes or investment/product fees or expenses, which would reduce the figures shown here. An index is a statistical composite that is not managed. It is not possible to invest directly in an index. Past performance is not a guarantee of future results.