Stocks hit new records as policymakers face challenging task ahead
ANTHONY SAGLIMBENE – CHIEF MARKET STRATEGIST, AMERIPRISE FINANCIAL
WEEKLY MARKET PERSPECTIVES — March 4, 2024

Both the S&P 500 Index and NASDAQ Composite closed last week higher. Each Index is up seven of the previous eight weeks and higher in sixteen of the last eighteen weeks. On the latter, that’s the longest such winning streak in over fifty years. In our view, strength across the stock market this year continues to defy skeptics and, importantly, seems to be building momentum. The S&P 500 topped 5,100 for the first time last week after surpassing 5,000 for the first time just a few weeks ago. The Index has made fifteen record highs in 2024 and on the back of continued strength across Information Technology and Communication Services. Interestingly, the NASDAQ crossed a record high last week for the first time since November 2021. The tech-heavy index had gone 569 trading days without recording a new all-time high. And while that seems like a long stretch, it's only the fourth longest on record. According to Bespoke Investment Group, the longest stretch between record closes for the NASDAQ occurred from March 2000 through 2015, or 3,801 trading days.
“Supportive U.S. economic data, improving profit growth, and earnings outlooks that remained stable throughout the fourth quarter reporting season are key factors that kept stocks in an upward trend during February.”
Anthony Saglimbene - Chief Market Strategist, Ameriprise Financial
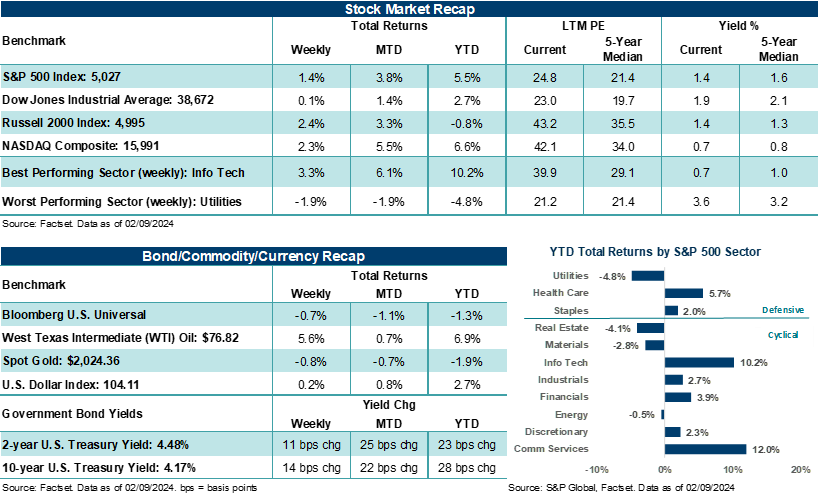
On the week, the Russell 2000 Index outpaced the S&P 500 by 200 basis points and continues to be a source of interest for investors looking to find areas that have not kept pace with the strong gains across other more expensive areas of the market, such as Big Tech. However, with 2-year and 10-year U.S. Treasury yields higher year-to-date and Federal Reserve rate cut expectations coming down, the interest rate-sensitive nature of small-caps has some investors remaining cautious on the asset category.
That said, government bond yields fell last week, with the 2-year Treasury yield finishing just above 4.50% – the lowest level since February 15. The U.S. Dollar Index was little changed on the week, and Gold climbed over +2.0%, posting its best week in two months. West Texas Intermediate (WTI) crude added roughly +3.0%, touching $80 per barrel for the first time since November.
Notably, the major U.S. stock benchmarks closed out February higher for the fourth straight month. The NASDAQ gained more than +6.0% in February, while the S&P 500 climbed over +5.0%. With inflation trends as well as Fed rate cut expectations roughly aligned with realistic assessments of the macroeconomic backdrop, stock prices have been able to grind higher over several weeks. In February, smaller-cap growth stocks outperformed, while Consumer Discretionary was the top-performing S&P 500 sector during the month. Interestingly, Industrials and Materials modestly outperformed Information Technology and Communication Services in February, indicating a slight shift in tone toward cyclical value areas. That said, the Magnificent Seven combined posted their best month of performance in nine months. However, with the backup in yields in February (e.g., the 10-year U.S. Treasury yield jumped nearly 40 basis points last month), most bond proxies finished the month lower. In addition, the market priced out roughly 60 basis points in Federal Reserve rate cuts in February, also putting some upward pressure on rates and downward pressure on bond prices. Bottom line: Supportive U.S. economic data, improving profit growth, and earnings outlooks that remained stable throughout the fourth quarter reporting season are key factors that kept stocks in an upward trend during February.
In Europe, the MSCI United Kingdom Index finished February essentially flat, while the MSCI European ex-UK Index gained +2.0%. Anemic growth trends, combined with still elevated inflation, have dampened rate cut expectations from the Bank of England and European Central Bank. However, unlike in the U.S., where economic growth has remained solid and helped to support stock prices, the absence of major growth catalysts (e.g., AI) weighed on European equities last month. In Asia, the MSCI All-Country Asia Pacific ex-Japan Index rose nearly +6.0% in February. Strong performance out of Taiwan, South Korea, and India helped push Asian stocks higher last month. Notably, China experienced improved performance in February, as officials lowered key lending rates and signaled a willingness to add further fiscal and monetary support if necessary.
Policymakers facing a challenging task
Here at home, an update on the Fed’s preferred inflation measure was the data point to watch last week. On an annual basis, the headline Personal Consumption Expenditure Price Index rose +2.4% in January, matching estimates and down from the +2.6% pace seen in December. Notably, Core PCE, which excludes food and energy, came in at +2.8% last month, also matching estimates and down from +2.9% in December. It’s worth noting that annualized measures of PCE are now back to early 2021 levels, with upside pressures last month largely coming from services. Bottom line: Several updates on the inflation front over the last few weeks suggest price pressures remain on a downward-sloping trend. However, some service components across the various reports remain stubbornly elevated, which likely keeps the Federal Reserve on the sidelines over the near term. This means that Fed messaging on wanting to wait for more data to assess their next move and to ensure inflation is on trend to target is something investors should take to heart.
While the Fed is very unlikely to raise its fed funds target rate from here, it’s also not in a position to cut rates anytime soon. Importantly, the market appears fine with this dynamic (for now) and could keep a tailwind behind stock prices.
That said, the current fed funds target rate is very elevated based on where inflation stands today. Thus, policymakers now have a challenging task ahead: Monitor inflation and growth trends on a largely backward-looking basis at a time when inflation is “near” target but not at a level that supports rate cuts just yet. Given the delayed effects of previous rate hikes, keeping a close eye on growth and employment trends over the coming months could carry far more weight than trying to manage inflation to an exact 2.0% target.
Finally on the week, Congress averted a government shutdown with another stopgap funding bill, February ISM manufacturing missed estimates, and February Consumer Confidence came in well below consensus.
The week ahead
As March gets rolling, the bulls can point to entrenched disinflation trends, well-established Tech momentum, growing prospects for broader market participation, and a stable economic/profit backdrop. The bears can challenge that assessment by pointing to sticky services inflation, high interest rates, stretched stock positioning, and still weak manufacturing activity. Interestingly, this week’s look at February ISM Services activity, which is expected to slow from January levels but remain in expansion, should grab some attention from investors on Tuesday. Services activity in the U.S. has remained in an expansionary state since bottoming in December 2022, and we believe it remains an important ingredient in maintaining a bullish narrative that continues to lean on a supportive economic backdrop.
That said, much of the economic focus this week will come from updates on labor trends. On Wednesday, the January Job Openings and Labor Turnover Survey (JOLTS) should show open roles in the U.S. falling by 151,000 from December levels, according to FactSet estimates. In addition, Wednesday’s February ADP private payrolls survey is expected to show job gains of +150,000, above the +107,000 private payrolls created in January but below the +200,000-job average seen over the last year.
But all eyes will be on Friday’s February nonfarm payrolls report. Economists expect job trends cooled in February, and materially slowed from January’s unexpectedly hot +353,000 job pace. FactSet estimates see February nonfarm payrolls coming in at +200,000 and the unemployment rate holding steady at 3.7%. From a growth perspective, the Federal Reserve would like to see slower job growth over the coming months, where the pace of job gains steadily moves toward longer-term averages. Bottom line: Job data that comes in hotter-than-expected this week and is seen as delaying Fed rate cuts could be greeted negatively by the market. Conversely, in-line or weaker-than-expected job data could be seen as supportive for rate cuts sooner than Fed forecasts, which the market could greet as a positive.
These figures are shown for illustrative purposes only and are not guaranteed. They do not reflect taxes or investment/product fees or expenses, which would reduce the figures shown here. An index is a statistical composite that is not managed. It is not possible to invest directly in an index. Past performance is not a guarantee of future results.